There are dozens of B2B marketing KPIs you could track, but only a handful will steer you toward your goals.
By focusing on three to five marketing KPIs, B2B businesses can better use their limited resources, align sales and marketing teams more effectively and improve funnel efficiency.
In this article, you’ll learn which KPIs are most important for your goals, how to track them and what a good benchmark looks like. You’ll walk away with a prioritized KPI list and a clear plan for improving your outcomes.
What are B2B marketing KPIs?
B2B marketing key performance indicators (KPIs) are data points that track progress toward marketing objectives and wider business goals. Use them to assess the effectiveness of your B2B marketing campaigns, see what’s working well and find ways to improve.
Are KPIs the same as metrics? KPIs and marketing metrics are similar, but they have different purposes. KPIs track progress toward business goals, while metrics track specific activities or processes. For example, email click-through rate is an email marketing KPI, but the number of emails sent is a sales metric.
B2B marketing KPIs are either quantitative or qualitative and leading or lagging:
Quantitative KPIs, like conversion rates, are objective and track progress using numerical data
Qualitative KPIs, like customer satisfaction score, are subjective and measure performance using opinions or ratings
Leading KPIs, like website visits, are forward-looking metrics that predict future performance
Lagging KPIs, like customer retention rate, measure the performance of past actions and highlight success after the fact
Tracking a combination of quantitative and qualitative, leading and lagging KPIs gives a complete picture of your marketing performance and helps you make continuous improvements.
Be careful of tracking too many KPIs at once, as this can be overwhelming and dilute your focus. Small businesses with limited resources should track three to five KPIs if they want to use the data to improve the quantity and quality of leads.
Knowing which KPIs align with your marketing objectives will help you understand which are the most important to watch.
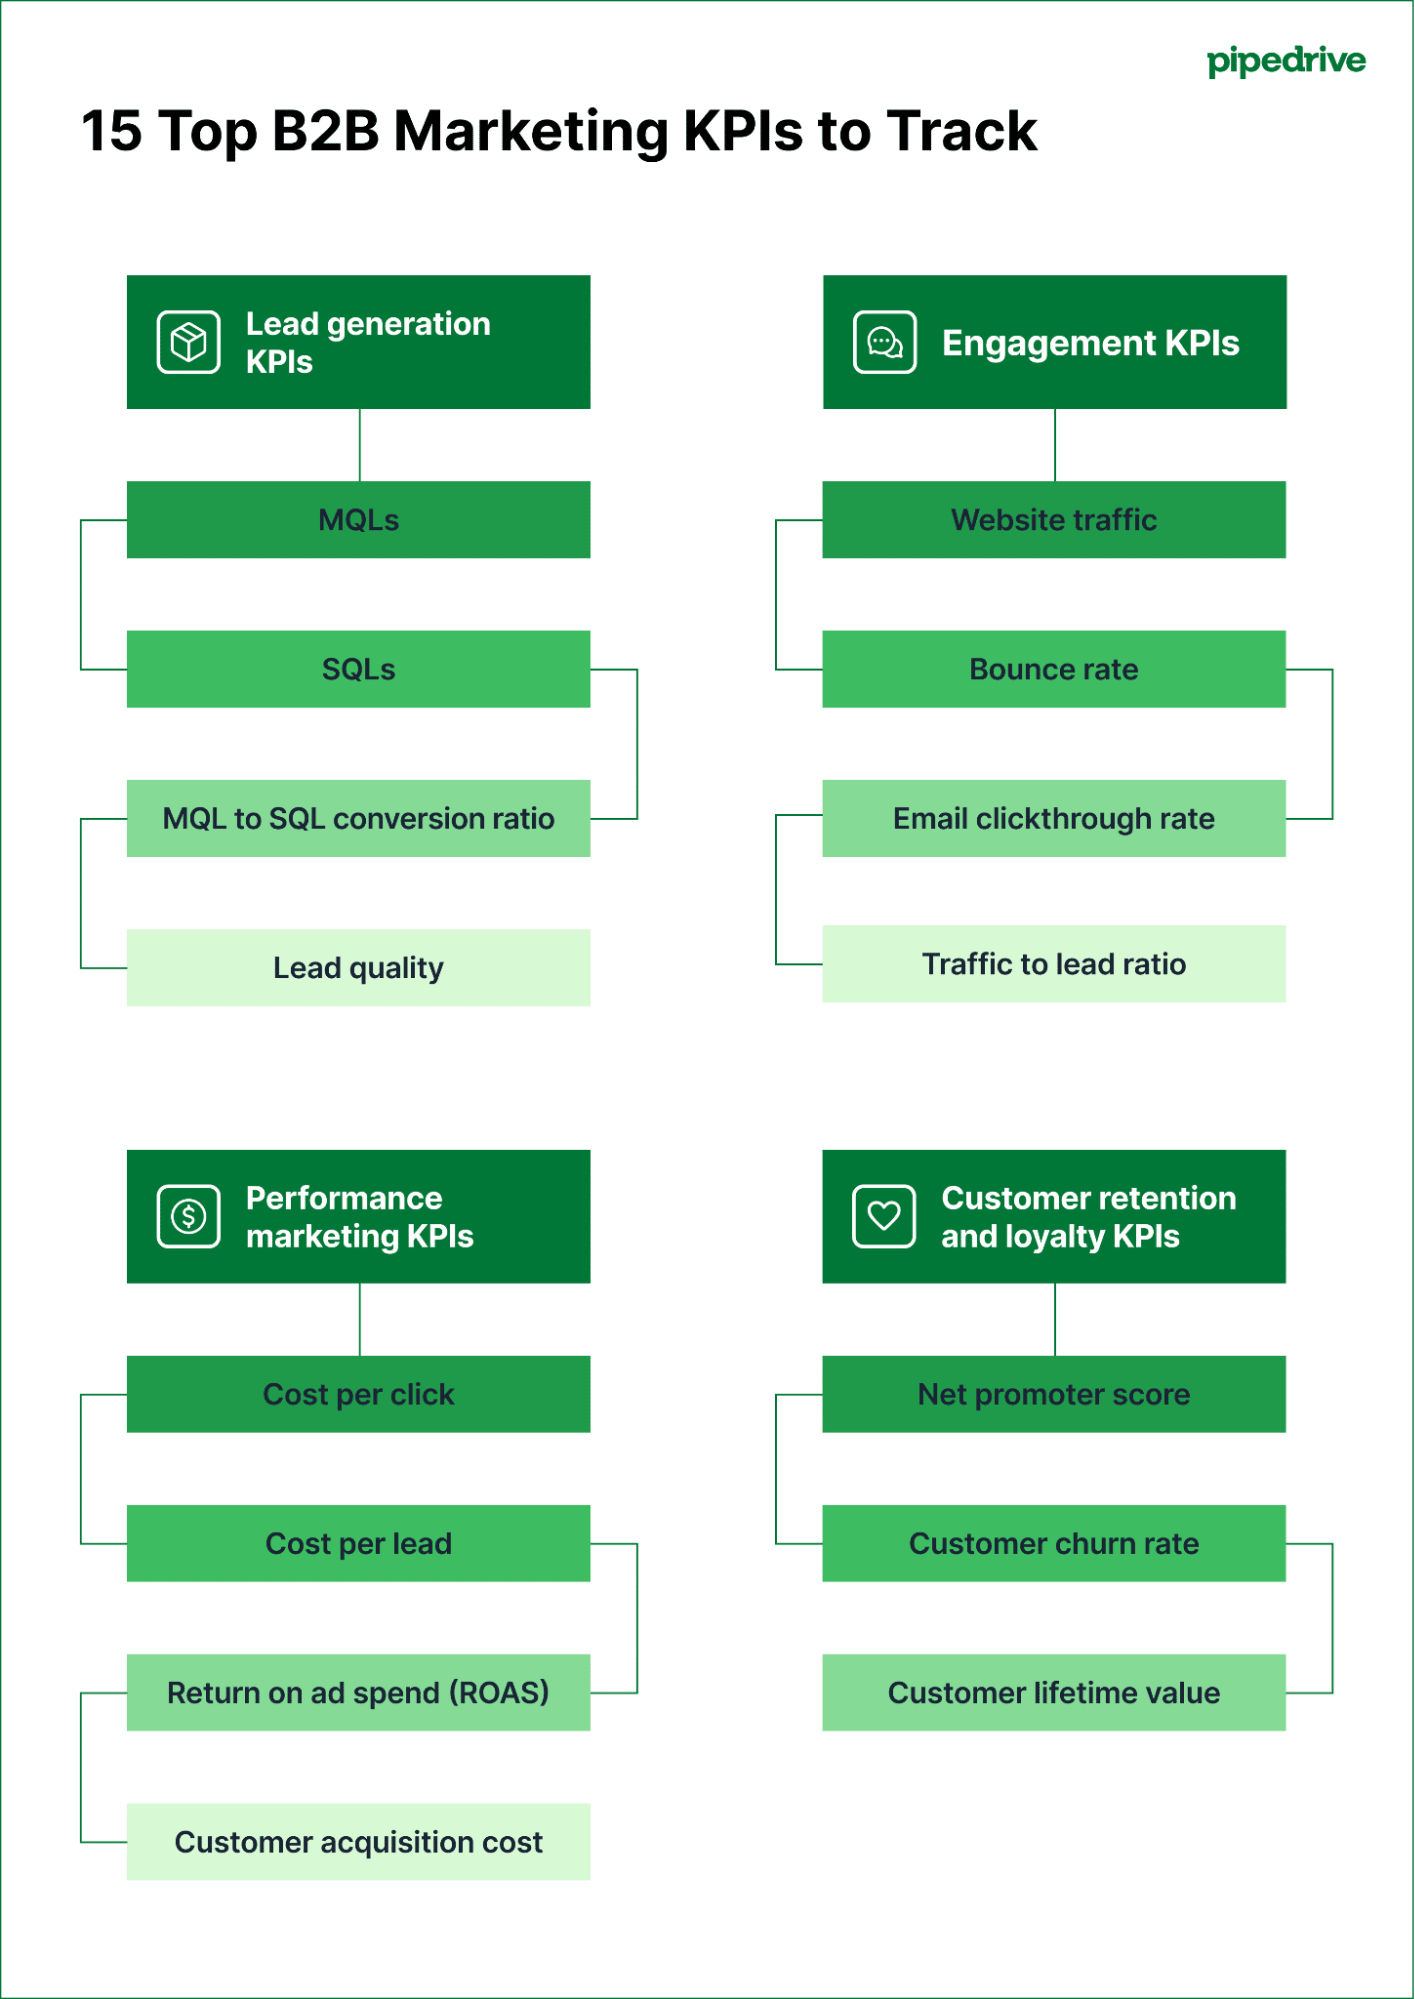
Below, we’ve sorted the most important marketing KPIs by goal, so you can narrow your focus and increase your success rate.
Lead generation KPIs
Every business wants more leads. Lead generation KPIs are the best way to measure the effectiveness and efficiency of your efforts to find the right prospects.
Some of the most important lead generation KPIs are:
MQLs
SQLs
MQL to SQL conversion ratio
Lead quality
Tracking these KPIs helps you identify which lead generation strategies drive the highest quality leads, so you can double down on what works, align better with sales teams and avoid wasting budget on underperforming campaigns.
MQLs
A marketing qualified lead (MQL) is someone who’s shown interest in your brand and looks like a good fit based on who they are and how they’ve interacted with you.
Leads may become MQLs after:
Downloading a whitepaper
Signing up for a newsletter
Repeatedly visiting your website
Requesting a sales demo
It is a lagging indicator measuring how effectively your marketing campaigns generate relevant, high-quality leads.
Why is it important? Tracking MQLs helps marketers assess the quality of their campaigns and how well they attract engaged leads that match buyer personas and ideal customer profiles.
What’s a good benchmark? The number of MQLs businesses generate depends on their audience and marketing budget. On average, small to mid-sized SaaS B2B companies have a 41% lead to MQL ratio (the percentage of leads that meet the criteria to become MQLs).
How to improve it:
- Improve targeting by refining ideal customer profiles and buyer personas using feedback from sales teams and customer success managers.
- Use marketing automation to nurture leads with personalized content tailored to their interests and stage in the customer journey.
- Prioritize marketing channels that produce the most MQLs, even if they don’t generate the most leads.
SQLs
Sales qualified leads (SQLs) are prospects deemed ready for direct engagement based on a sales methodology like BANT.
Why is it important? The number of SQLs in your sales funnel is an excellent indicator of future revenue. It also helps you assess the effectiveness of your marketing efforts at driving high-quality leads
What’s a good benchmark? Like MQLs, the number of SQLs businesses generate will differ depending on audience size and budget. The next KPI in our list, MQL to SQL conversion rate, offers a better way to benchmark your success, so calculate that first.
How to improve it:
- Implement a lead scoring system to prioritize the best quality leads.
- Use an AI sales assistant to automatically highlight leads with the highest purchase intent.
- Nurture leads with personalized content tailored to pain points.
MQL to SQL conversion rate
Your MQL to SQL conversion rate is the percentage of marketing qualified leads that become sales qualified leads.
Here’s how to calculate MQL to SQL conversion rate:
MQL to SQL conversion rate = (SQLs / MQLs) x 100
Why is it important? Your MQL to SQL conversion rate reflects the quality of the leads your marketing team generates and the efficiency of your lead nurturing processes.
What’s a good benchmark? The average MQL to SQL conversion rate for small and medium-sized SaaS companies is 39%.
How to improve it:
- Enhance lead nurturing workflows with targeted content and automated touchpoints
- Foster strong communication channels between marketing and sales teams to increase alignment on what a good lead looks like and guarantee rapid feedback on lead quality
- Use data analytics to identify and focus on high-converting lead sources
Lead quality
Lead quality measures how likely a lead is to convert into a customer based on their fit, intent and level of engagement.
Measure quality using a lead scoring system that assigns numeric values to attributes like the prospect’s budget, the decision-maker’s level of authority and their readiness to buy.
Why is it important? High-quality leads convert faster and should spend more. Focusing on high-quality leads increases sales efficiency and reduces wasted resources.
How to improve it:
- Continuously update and refine ICPs using sales and customer success data to ensure you target the best audiences.
- Add more form fields to gated assets to collect as much information as possible.
- Use stricter guidelines to narrow your target audiences when running digital marketing campaigns so you hone in on the best prospects.
Score leads and identify opportunities with your lead scoring template
Engagement KPIs
Engagement KPIs track how actively and meaningfully your audience interacts with your brand across channels like your website, email and social media platforms like LinkedIn.
Some of the most important engagement KPIs for B2B brands are:
Website traffic
Bounce rate
Email clickthrough rate
Traffic to lead ratio
Tracking these KPIs helps you assess how well your marketing resonates with target audiences. High engagement often correlates with stronger brand affinity, higher conversion rates and improved customer retention.
Website traffic
Website traffic is the number of people visiting your website. Drill deeper by tracking traffic from different sources, like:
Paid ads
Social media
Organic search
Third-party domains like comparison sites
Why is it important? Because your website is the centerpiece of your marketing efforts, hosting most of your content, traffic is a great top-of-the-funnel indicator of campaign effectiveness and prospect engagement. It’s also an indicator of potential leads – the more traffic, the more potential customers.
What’s a good benchmark? In the SaaS industry, websites generate 3,160 sessions per month on average.
How to improve it:
- Invest in search engine optimization (SEO) to acquire high-quality traffic from search engines like Google.
- Link to your website on social media to transfer traffic from third-party networks to your own platform.
- Create paid advertising campaigns to drive traffic from search engines, social media platforms and other sites.
Bounce rate
Bounce rate is the percentage of website visitors who leave your site without taking another action, such as clicking a link, downloading a gated asset or visiting another page.
Here’s how to calculate bounce rate:
Bounce rate = (Number of one-page visits / Total number of visits) x 100
Why is it important? Bounce rate helps you assess whether your website is meeting visitor needs. A high bounce rate suggests performance issues (like slow site speed), engagement problems (like low-quality content) or that your campaigns target the wrong audience.
What’s a good benchmark? For a B2B website, the average bounce rate is 50.59%.
How to improve it:
- Improve page speed and optimize your site for mobile users to stop visitors from leaving immediately.
- Align content with your target audiences and send visitors from paid ad campaigns to a personalized landing page.
- Use clear calls to action and internal links to encourage visitors to explore your website further.
Email clickthrough rate (CTR)
Email clickthrough rate is the percentage of email recipients who click on at least one link in an email campaign.
Here’s how you calculate it:
Email clickthrough rate = (Number of clicks / Number of emails sent) x 100
Why is it important? It’s not enough for prospects to open your email; genuine engagement only occurs if they click a link to find out more. Tracking click-through rates helps you measure the relevance of your content to audiences and optimize marketing messages accordingly.
What’s a good benchmark? Average clickthrough rates for IT and software companies stand at 2%.
How to improve it:
- Segment email lists to deliver more targeted and relevant messaging.
- Craft compelling offers and persuasive calls to action that encourage readers to act once they open your email.
- Optimize email design for mobile devices to make emails easier to read.
Traffic-to-lead ratio
Traffic-to-lead ratio is the percentage of website visitors who convert into leads. It measures the effectiveness of your website at generating prospects.
Here’s how to calculate it:
Traffic-to-lead ratio = (Total website leads / total new visits) x 100
Why is it important? Having thousands of website visitors is no good if none turn into prospects. Tracking your traffic-to-lead ratio ensures you’re generating high-quality traffic.
What’s a good benchmark? The average traffic-to-lead conversion rate for B2B SaaS brands is 2.5%
How to improve it:
- Optimize landing pages and simplify lead capture forms to increase form submission rates.
-Use personalized CTAs (calls to action) based on visitor behavior and demographics.
-Offer valuable gated content like whitepapers and reports to increase lead generation.
Performance marketing KPIs
Performance marketing KPIs track marketing campaign performance, often in relation to revenue and other income sources.
Some of the most important performance marketing KPIs for B2B brands are:
Cost per click
Cost per lead
Return on ad spend (ROAS)
Customer acquisition cost
Tracking these metrics measures the cost-effectiveness of your campaigns, so you can see how well your marketing investments translate into real business results and invest future budgets in the most profitable campaigns.
Cost per click
Cost per click (CPC) is an advertising KPI that measures the amount you pay every time a prospect clicks on your ad.
Why is it important? Tracking CPC helps marketers understand and improve the cost-effectiveness of paid advertising campaigns. It helps them control budgets and optimize bidding strategies to drive more clicks for fewer dollars.
What’s a good benchmark? CPCs vary depending on the advertising platform and industry. The average CPC on Google Ads for technology companies is $3.80
How to improve it:
- Keep ads highly relevant to the target audience to improve your Google Quality Score and lower costs.
- Continuously A/B test ad copy and creatives to boost click-through rates.
- Use the automated bidding strategies offered by platforms.
Cost per lead
Cost per lead (CPL) is the average amount you spend to acquire a new lead.
Here’s how you calculate it:
Cost per lead = Total marketing spend / Number of new leads
Why is it important? Cost per lead is another way to track the cost-effectiveness of your marketing campaigns. It helps marketers assess advertising channels and optimize spending to acquire leads at the lowest possible cost.
What’s a good benchmark? The average cost per lead for a B2B SaaS company is $310
How to improve it:
- Audit campaigns to identify and cut low-performing channels or ads.
- Optimize landing pages and lead capture forms to improve conversion rates.
- Use retargeting to nurture prospects that have clicked on your ads but not yet converted.
Return on ad spend (ROAS)
Return on Ad Spend (ROAS) calculates how much revenue you generate for every dollar you spend on advertising. It tracks the return on investment of your advertising campaigns.
Here’s how you calculate it:
ROAS = Total campaign revenue / Total campaign cost
Why is it important? ROAS helps marketers understand the effectiveness and profitability of their ad spend. A high ROAS can justify marketing investments and help small businesses optimize resource allocation.
What’s a good benchmark? Average ROAS will depend on your industry and advertising platform. For a B2B SaaS company advertising on Google, the average ROAS is 1.63.
How to improve it:
- Target ads to audiences with high purchase intent to increase conversion rates
- Optimize landing pages and user experience to maximize revenue per visitor
- Use multi-touch attribution models to allocate budget to the most effective channels
Customer acquisition costs (CAC)
Customer acquisition cost is the cost of winning a new customer. It includes all marketing and sales expenses, as well as salaries and overhead.
Here’s how you calculate it:
CAC = Total sales and marketing costs / net new customers
Why is it important? Tracking CAC helps you set budgets and keep marketing efforts sustainable. You don’t want to spend more on each customer than they spend with you.
What’s a good benchmark? The average CAC in the SaaS industry is $702
How to improve it:
- Increase conversion rates at each funnel stage
- Focus on high-quality leads who are more likely to convert
- Improve customer retention rates to increase customer lifetime value
Customer retention and loyalty KPIs
Customer retention and loyalty KPIs measure how well you keep customers over time and how likely they are to advocate for your brand.
Some of the most important B2B customer loyalty KPIs are:
Net promoter score
Customer churn rate
Customer lifetime value
Tracking these KPIs helps you understand what customers think of your brand. This information allows you to take steps to build stronger customer relationships, enhance word-of-mouth marketing and boost key revenue metrics, such as monthly recurring revenue (MRR).
Net promoter score
Net Promoter Score (NPS) is a customer loyalty and satisfaction metric that measures how likely customers are to recommend a company, product or service to others.
Calculate it by asking customers a single question. “On a scale from 0 to 10, how likely are you to recommend us to a friend or colleague?”
Then subtract the percentage of detractors (those who say from zero to six) from the percentage of promoters (those who say a nine or 10) to get your NPS.
Why is it important? NPS serves as a strong predictor of business growth and customer loyalty. A high NPS indicates a healthy relationship with customers who act as brand evangelists, driving referrals and positive word-of-mouth.
How to improve it:
- Actively collect and analyze customer feedback to understand the reasons behind scores and improve accordingly.
- Address detractor concerns promptly through improved customer service and product enhancements.
- Enhance the overall customer experience by streamlining support, delivery and onboarding processes.
Customer churn rate
Customer churn rate is the percentage of customers who don’t renew their subscription or make another purchase over a given period.
Here’s how you calculate customer churn rate:
Customer churn rate = (Number of customers lost over period / number of customers at start of period) × 100
Why is it important? Monitoring your churn rate will help you quickly spot product, offer or customer support issues.
What’s a good benchmark? For SaaS brands, the average churn rate stands at around 14%
How to improve it:
- Improve the onboarding experience to help customers find value quickly
- Have customer success teams walk new customers through using your software to solve common pain points
- Build loyalty programs that reward customers who continue subscribing
Customer lifetime value (CLV)
Customer lifetime value measures how much money an average customer spends over their lifespan.
Here’s how to calculate customer lifetime value:
CLV = Average customer value × average customer lifespan
Why is it important? CLV guides how much you should spend on acquiring new customers. A high CLV means you can spend more to acquire each lead. It also highlights profitable customer segments, so you can focus on attracting the highest value customers.
What’s a good benchmark? B2B SaaS brands should aim for a CLV greater than 3:1.
How to improve it:
- Offer relevant upsells and cross-sells to customers frequently throughout the relationship to encourage bigger purchases.
- Increase customer retention by delivering proactive and high-quality support that addresses issues before they escalate and cause customers to churn.
- Enhance the customer experience through user experience testing to make your product more enjoyable for customers.
Why is it important to track B2B marketing KPIs?
KPIs give your B2B marketing team feedback and direction. They show how they’re progressing toward marketing goals, which campaigns should be improved or archived and how to focus limited resources for maximum impact.
Tracking B2B marketing metrics improves your ability to do the following:
Set goals and monitor progress with ease. Research shows that marketers who set goals are 377% more successful than teams that don’t.
Prioritize marketing efforts to drive business growth. Tracking KPIs makes it easy for C-suite leaders to focus on marketing, making their companies twice as likely to achieve more than 5% revenue growth.
Build accountability and transparency within marketing teams. KPIs offer a way of measuring your marketing department’s success and demonstrating its impact to stakeholders – something 82% of marketers say they can do.
KPIs turn marketing from an art into a science by providing actionable insights and objective data to influence tomorrow’s strategies.
For example, package surfing holidays provider SurfaWhile spotted an opportunity to increase lead and engagement KPIs by automating sales and marketing processes with Pipedrive.
New contact forms, chatbots and live chat functionality gave the company more ways to connect with audiences and nurture leads. Tracking KPIs let SurfaWhile know it was on the right track, and the company almost tripled its number of leads.
Three ways to track B2B marketing KPIs
Marketers use a combination of customer relationship management (CRM) systems, AI tools and analytics reporting tools to visualize KPIs and automate their reporting initiatives.
Here’s how these three solutions can help you track your most important KPIs.
1. CRMs like Pipedrive
Pipedrive is a CRM that makes it easy to manage the sales cycle, monitor leads and automate sales tasks. The platform’s dashboards give real-time insight into your sales and marketing efforts.
Marketers can use Pipedrive’s reports and insights feature to create interactive dashboards that track many of the above KPIs, such as MQLs, SQLs and MQL to SQL conversion rate.
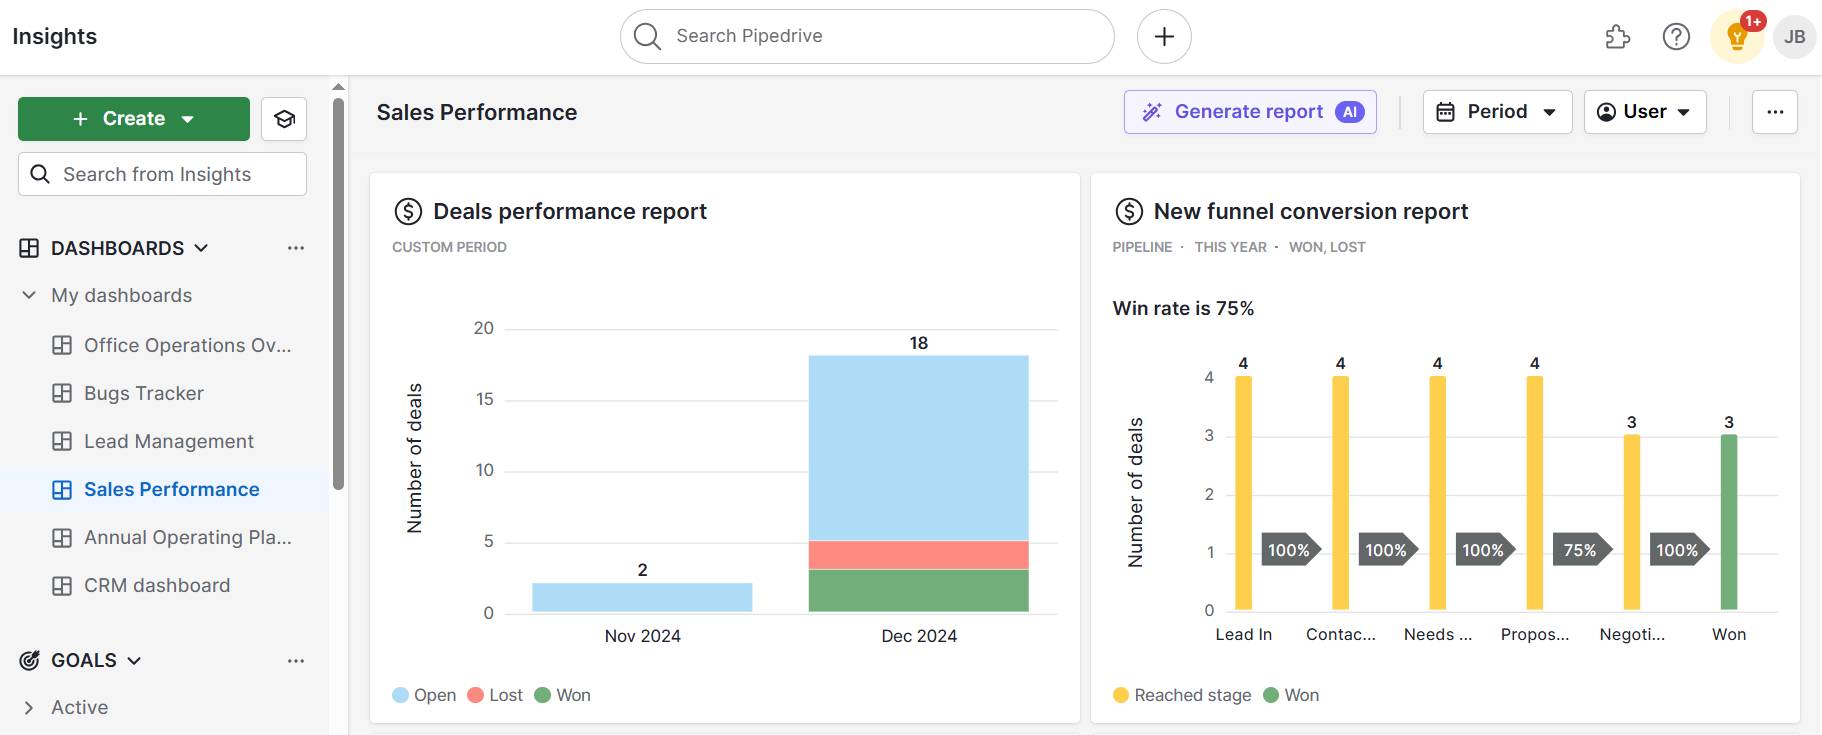
Use the following chart types to display KPIs in a way that makes sense to you:
Column chart
Bar chart
Pie chart
Scorecard chart
Table chart
Keeping key KPIs front and center in dashboards makes it easier to optimize campaigns, acquire more prospects and grow revenue.
For example, content marketing studio Inkwell has used Pipedrive’s dashboards to triple revenue and maintain 32% yearly growth.
In the words of managing director Chris Goodfellow:
Pipedrive also connects to over 500 business applications to maximize your sales and marketing data.
2. AI reports like Pipedrive’s AI report generator
Conversational chatbots help marketers save time they would have spent creating customized reports to track the right metrics. A simple prompt can give you the answers you need in seconds.
For example, Pipedrive’s AI report generator gives marketing managers and sales leaders 14 pre-written prompts or lets them ask questions, like “How many MQLs did we generate last month?”
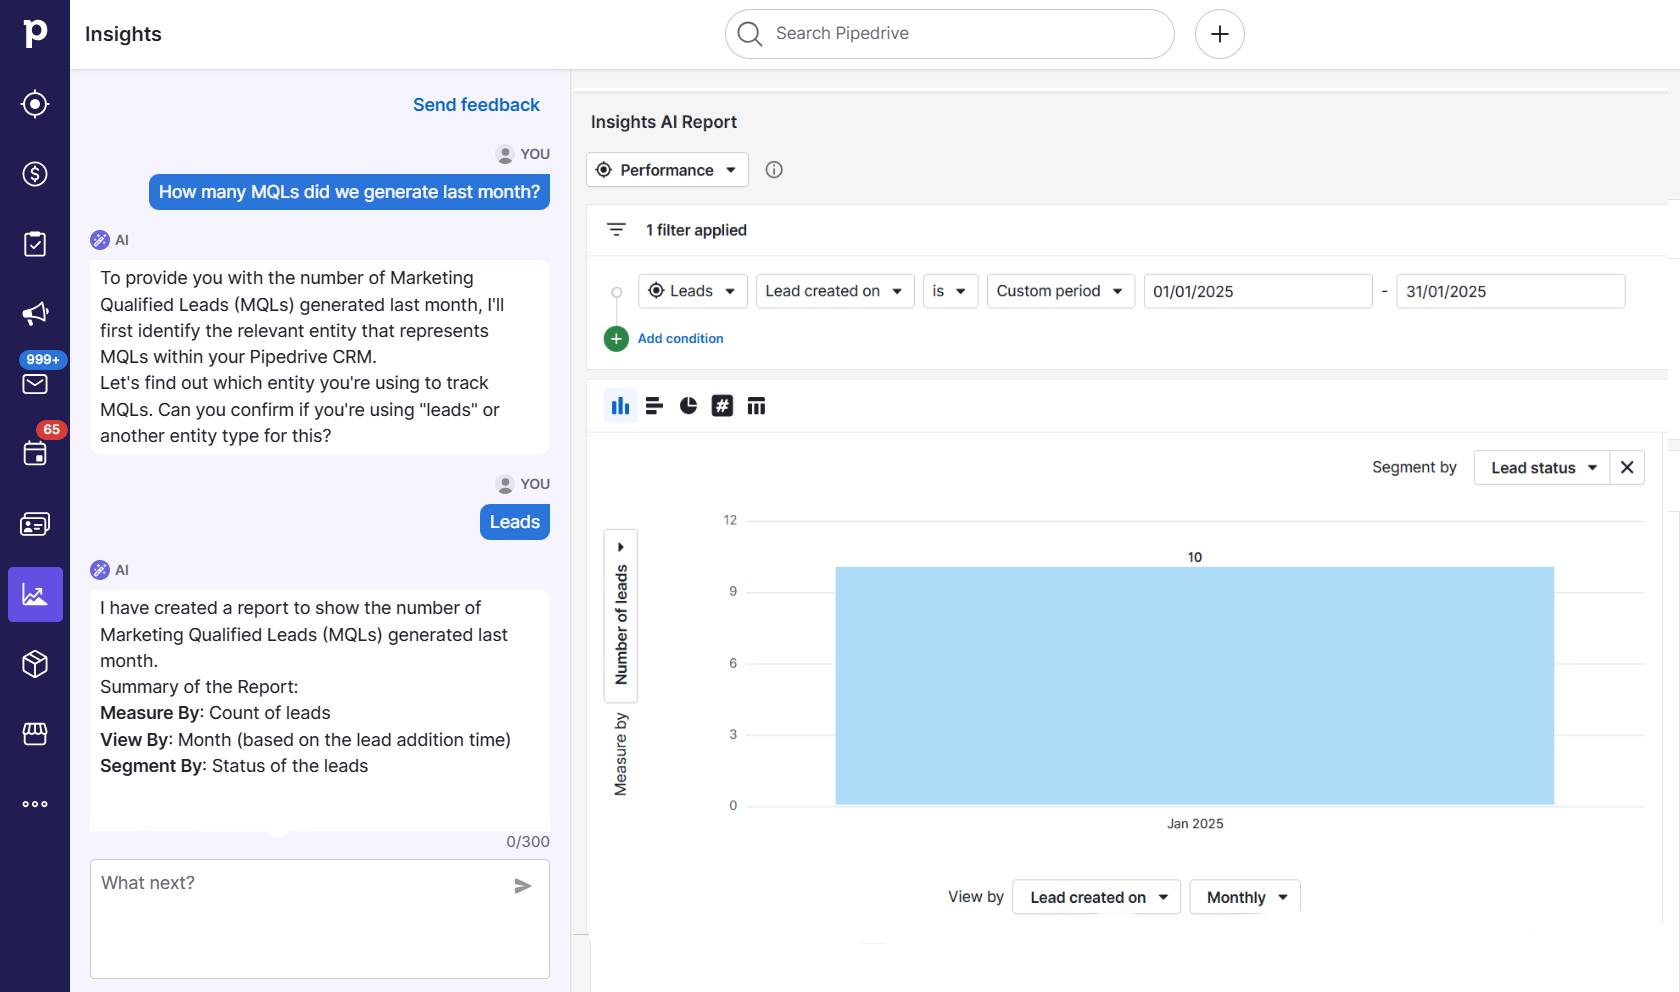
Once Pipedrive generates your report, you can continue speaking to the chatbot to customize the results and improve your report further.
Note: Pipedrive’s AI report generator is available on all plans.
3. Analytics platforms like Google Analytics
Analytics platforms use a snippet of code to track what happens on your website, converting data into customized reports and dashboards.
Use analytics platforms to track web and performance marketing KPIs like:
Website traffic
Bounce rate
Return on ad spend
Customer acquisition costs
Google Analytics is a free way to get a reasonably complete picture of your marketing metrics, thanks to integrations with other tools like Google Ads and Search Console. It centralizes acquisition, engagement and advertising data into dashboards like the one below.
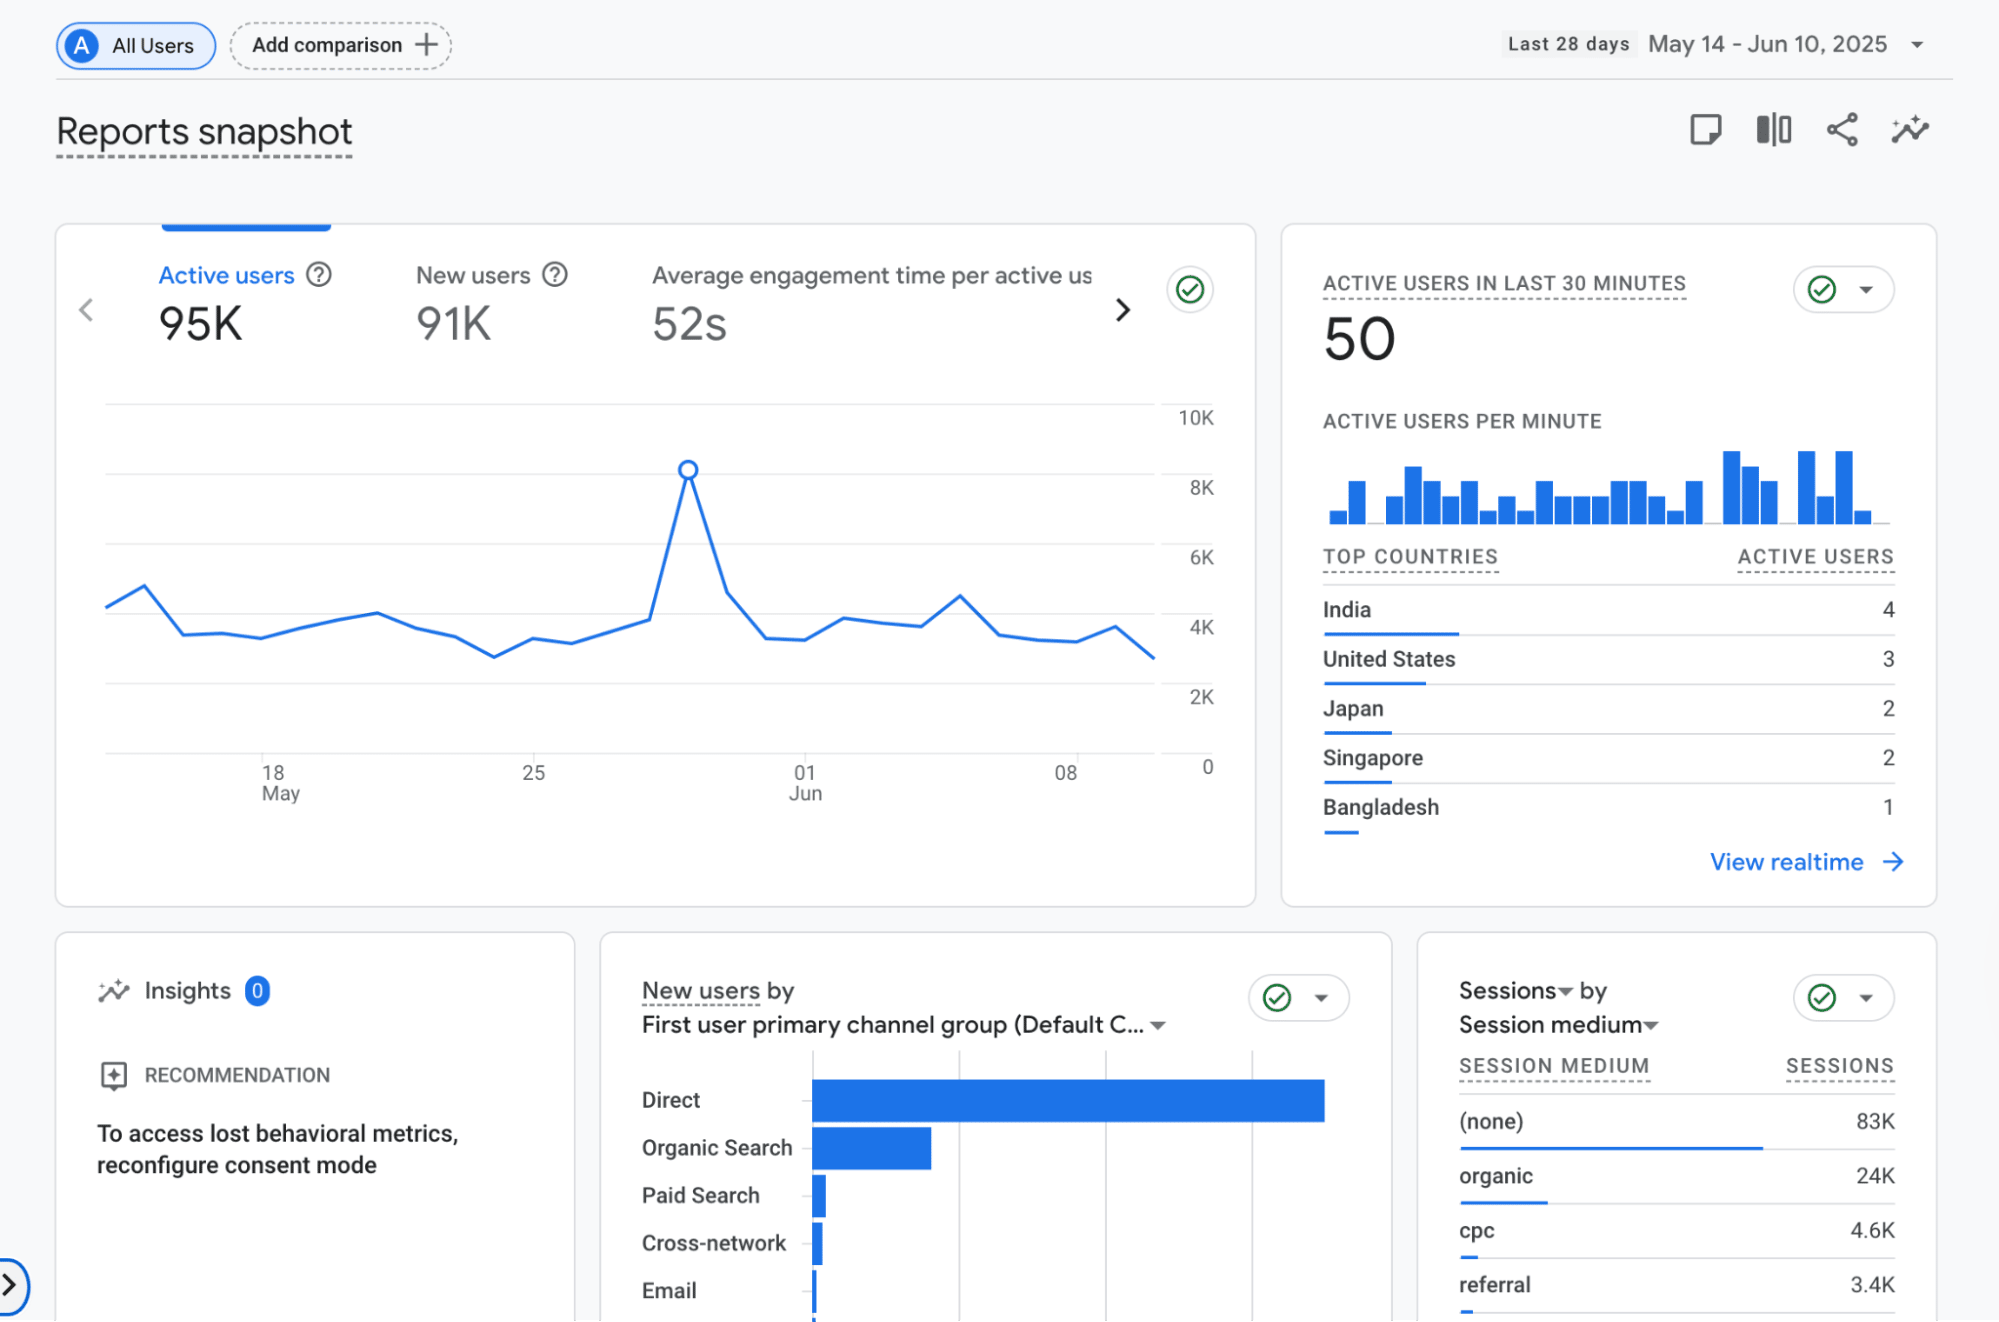
Analytics platforms can’t track what happens when prospects leave your website, so you’ll want to pair the platform with a CRM like Pipedrive.
Final thoughts
Tracking B2B SaaS marketing KPIs holds your marketing team accountable, gives them actionable data to improve their campaigns and increases the likelihood that your sales team will receive a steady stream of high-quality MQLs and SQLs.
With Pipedrive’s powerful reporting and pipeline features, you can improve your marketing efforts and give sales teams all the features they need to convert leads into customers. Learn more about how Pipedrive can align sales and marketing with a 14-day free trial


