

If you want to run an effective sales team, you need to own your data and have a rigorously tested sales reporting strategy.
Most sales aren’t closed in a single meeting – they require consistent tracking and follow-up.
This guide highlights how to use sales report templates to uncover valuable insights for nurturing leads and closing more deals. Plus, discover nine sales report templates to help you review, evaluate and forecast team goals.
Key takeaways about sales report templates
A sales report template is a structured way to track key sales metrics, making performance easy to understand and compare.
Using sales report templates helps turn sales data into clear insights that improve forecasting and decision-making.
Sales teams often struggle with scattered data and inconsistent reporting, which templates solve by standardizing how performance is tracked.
Pipedrive brings reporting and pipeline tracking together in one place with real-time dashboards and automated insights
Why sales reports are so important to your business
. To keep day-to-day sales activities running smoothly, you need sales reports to track performance, guide decision-making and align teams on goals and priorities.
Here are some big-picture benefits of a consistent, in-depth sales reporting process.
Align company and sales goals. Use shared sales data to set clear targets, improve collaboration between teams and ensure sales representatives understand exactly what success looks like so everyone is working toward the same outcomes.
Boost sales rep accountability. Track individual and team performance to identify top performers and those who need support, then use regular reports and check-ins to reinforce expectations, improve motivation and encourage consistent improvement.
Encourage a collaborative company culture. Share performance data across the team to reduce siloed working, build healthy alignment around shared sales goals and motivate reps to support each other in hitting collective targets.
Get accurate sales forecasts. Rely on real performance data to predict revenue more reliably, improve decision-making around hiring and strategy and set sales targets that are both realistic and achievable.
Consistent sales reporting turns day-to-day activity into clear direction, helping you and your team make confident decisions that drive revenue growth.

Sales Pipeline Course
9 sales report templates your team can actually use
Sales report templates give your team practical, ready-to-use formats for tracking performance, spotting trends and forecasting results more accurately.
In the sections below, we outline common sales report template types and show you how they look so you can create your own.
1. Sales pipeline report
A sales pipeline report template provides a clear, high-level view of where deals stand so you can forecast revenue and spot gaps early.
Here’s an example of how this sales report might look:

Rather than dig into the specifics of your sales cycle and individual team performance, an effective pipeline sales report template focuses on the big picture. As a result, it’s an ideal resource to share with stakeholders outside of your sales team.
Free templates to track sales
The report also covers the status and progress of your team’s deals. It’s a straightforward way to predict and forecast your deals in Microsoft Excel or Google Sheets if you don’t yet have a dedicated reporting tool or CRM.
Note: As your team grows, you’ll likely need to migrate to a dedicated client relationship management (CRM) system to manage sales growth and gain deeper visibility into individual sales activities. Find out more about why a CRM is important for business growth.
2. Weekly sales report
A weekly sales report helps sales managers quickly track team performance and spot trends, enabling them to take action without micromanaging.
The data in this report is also useful for weekly sales meetings or stand-ups.
Here’s a weekly sales report template:

A weekly sales report primarily examines individual sales reps’ performance and actions. For example, who wins the most sales leads? Who conducts the most outbound calls?
You can also use weekly sales reports to track total meetings and conversions, ensuring that your team is operating at peak sales productivity.
3. Monthly/quarterly sales report
A monthly or quarterly sales report helps you track long-term performance trends and assess the overall health of your sales funnel and revenue.
Here, you’re focused on big-picture trends, like the overall health of your sales funnel and revenue.
Take a look at this quarterly sales report template (created using a Pipedrive dashboard):

A monthly sales report template gives your sales team enough time to gather actionable data. If you want to determine what’s working and what’s not, a month or two is typically more than enough time.
For example, a consistent drop in conversions or calls made month-to-month is a cause for alarm, while an uptick in sales or conversions shows you that you’re doing something right. Accurate reporting will help you determine what to keep doing and how to keep doing it.
A monthly or quarterly report is also useful for sharing beyond your team. The report provides a general overview of how your sales department is doing in your company’s context.
4. Individual (or team) progress report
A sales progress report template tracks individual and team performance, helping you improve accountability and replicate what’s working.
Below is an example of a smaller team report (broken down by individual performance) in Pipedrive:

Individual reporting gives you a clear view of your top-performing reps and what they’re doing well. It also lets each rep access their own data and instills a sense of accountability.
For example, if a rep sees their conversion rate is lower than the team average, they can adjust their approach, refine their messaging or focus on higher-quality leads to improve results.
Note: Pipedrive’s CRM lets you control user permissions and access for sharing sales performance. You can limit individual access to certain reports so you don’t have to worry about reps looking over each other’s shoulders.
5. Lead status target report
A lead status target report template tracks each lead’s position in the pipeline and shows what needs to happen next to move them toward a sale.
Here’s an example of a lead report in Pipedrive, where each deal is assigned to a different stage in the sales pipeline:

Monitoring your lead status means keeping tabs on each interaction that moves them closer to becoming a customer. This report gives you an actionable to-do list of next steps for nurturing your most valuable leads.
For instance, if a lead has received a proposal but hasn’t responded, the next step might be a follow-up call or email to re-engage them and keep the deal moving forward.
6. Annual sales plan report
An annual sales plan template sets clear targets and builds a practical roadmap to hit your revenue goals throughout the year.
Here’s an example of an annual sales plan:

Your annual sales plan builds off last year’s reporting to help you determine your sales targets, campaigns and how many reps you need to pull it all off.
With this information, you can allocate resources more effectively, prioritize the right initiatives and make more confident hiring and budgeting decisions.
7. Sales and marketing report
Reporting on sales and marketing performance in the same sales report template helps you monitor how well they’re working together, which improves alignment.
Here’s a sales and marketing report example:

Tracking your most valuable marketing channels goes hand in hand with improving return on investment across both teams. Include leads from Google, paid ads, cold email, sales calls, blog content, social media and more.
Sales and marketing should work closely on both strategy and reporting. This cooperation not only streamlines the sales process but also gives you clearer insight into which lead sources perform best, such as email versus paid or organic channels.
8. Daily sales report template
A daily sales report template tracks day-to-day activity like communication history and next steps, helping you stay on top of performance in real time.
Here’s an example of a daily sales report template:

Daily sales activity reports should be short and to the point. Rather than worrying about trends, these reports focus on the facts of a given day, letting you quickly understand immediate performance. You can then spot where small adjustments can improve results straight away.
Say that you notice fewer meetings booked than usual, but a high number of calls made. In this situation, you might adjust your outreach messaging or the timing of your email follow-up the next day to improve conversions.
9. Activities report
Activities report templates allow you to take an in-depth look at your team’s productivity and identify which activities are helping you drive more sales.
Take a look at the example below of a sales activities report in Pipedrive:

With accurate activities reports, you can see who’s completing the most tasks, compare planned versus completed work and identify where activity is falling short.
This overview makes it easier to understand what’s actually happening day to day. You can spot gaps between effort and output, and adjust priorities so the team focuses more on activities that drive sales.

Benefits of sales reporting to drive short-term action and long-term strategy
Effective sales reporting helps you make faster decisions and shape a stronger long-term sales strategy.
It’s a powerful tool that fuels immediate course corrections and long-term strategic planning.
Here’s how different sales reports contribute to this process.
Daily sales reports: spotlight on activity
Daily sales reports give you an immediate view of team activity so you can spot and fix issues before they impact performance.
These reports provide a real-time snapshot of your team’s sales activities. They track performance metrics like the number of calls made, emails sent, meetings booked and presentations delivered.
By monitoring these activity levels, you can identify potential issues early on. For instance, a sudden drop in calls made could indicate a scheduling conflict or a need for additional sales training. This insight allows you to take swift action to ensure your team stays on track.
Weekly sales reports: identify trends and make adjustments
Weekly custom reports allow you to see patterns emerge over a slightly longer timeframe, so you can investigate and address any concerning trends before they significantly impact your sales pipeline.
For example, a dip in conversion rates might prompt you to revisit your sales pitch or refine your lead qualification process. Weekly reports empower you to make these adjustments quickly and effectively.
These reports also reveal trends, such as changes in average deal size or shifts in lead quality.
Monthly sales reports: big picture analysis and better decisions
Monthly reports offer a broader perspective, revealing seasonal trends, pipeline health over time and the overall effectiveness of your sales strategies.
Monitor key metrics like sales growth (month-over-month, year-over-year), win rates and customer acquisition cost (CAC). This comprehensive data empowers you to make informed strategic decisions.
You can identify areas for improvement, adjust sales targets based on realistic forecasting and allocate resources more effectively.
What are some important KPIs for sales reporting?
The most useful sales KPIs clearly show how your team’s activity turns into revenue, so you can focus on what actually drives results.
There are plenty of sales metrics to help measure success. You can’t possibly fit them all in a single sales report template (nor should you try).
Here’s a rundown of important sales KPIs to watch throughout your reporting to turn data into action.
Emails sent and/or calls made | What it means: Number of outreach activities your reps complete, like calls, emails and meeting requests. Why it’s important: Shows how active your team is and connects effort to outcomes. |
Completed activities per user | What it means: Total number of sales tasks each rep completes over a set period. Why it’s important: See who’s consistently active and which behaviors are driving results. |
New deals added | What it means: Number of new opportunities added to your sales pipeline. Why it’s important: Shows whether your pipeline is growing and if lead generation is strong enough to support future revenue. |
New deal value | What it means: Estimated revenue value of new deals added to the pipeline. Why it’s important: Helps you understand deal quality and prioritize high-value opportunities. |
Deals won | What it means: Opportunities that successfully convert into customers. Why it’s important: Measure sales effectiveness to see what’s working in your process. |
Deals lost | What it means: Opportunities that exit the pipeline without converting. Why it’s important: Spot weak points in your funnel and fix recurring issues. |
Lead conversion rate | What it means: Percentage of leads that turn into paying customers. Why it’s important: Shows how efficiently your sales process turns interest into revenue. |
Average conversion time | What it means: Average time it takes a lead to move from first contact to closed deal. Why it’s important: Understand your sales cycle and set realistic performance expectations. |
Although these are all useful metrics to track, the right KPIs depend on your business model and goals. It’s important to focus on the metrics that reflect what success looks like for you.
For example, a SaaS business might prioritize conversion rate and churn, while a high-ticket B2B team may focus more on deal value and sales cycle length.
How to make your sales reports effective
Effective sales reports turn data into clear actions that your team actually uses to improve performance.
Here are some tips to help you use sales reports effectively.
Share your sales performance reports with your team
Sharing sales performance reports with your team keeps everyone aligned, engaged and focused on improving results together.
All of the sales templates above are ready to share. There’s no “right” way to share your data, but here are some quick ideas that go beyond face-to-face meetings:
Reviewing via screen-sharing platforms (such as Zoom)
Featuring reporting data on your Kanban board (e.g., Trello, Asana)
Scheduling weekly or monthly emails that highlight your key sales reports
Anything you can do to make your reporting more accessible and shareable is a plus. For instance, present data in easy-to-read visuals, such as graphs and pie charts.
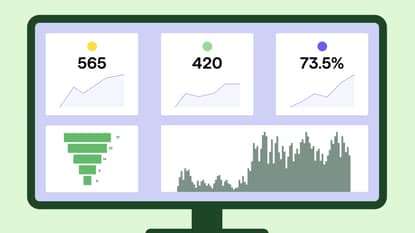
Take Pipedrive’s customizable dashboards, for example. The dashboards bring key sales metrics into one view so your team can track performance in real time, spot trends quickly and focus on the activities that drive results.
Watch this video to find out more about Pipedrive’s insights and dashboards:
Pressing play on the video above will set a third-party cookie. Please read our cookie policy for more information.
Give your reps a pulse on what’s happening and how they can improve. Reports are a time-efficient way to provide those answers at a glance.
Don’t drown your team in data
Sharing the right data with sales reps ensures they’re confident and clear on what to do next, without unnecessary detail getting in the way.
Reporting can almost be addictive. The more you dive into your data, the deeper you want to go into the details and specifics.
However, stick to the facts when sharing total sales volumes with your team to prevent overwhelming them. Simplify reports by determining in advance which KPIs you share and how often you send them.
There is no one-size-fits-all approach to reporting frequency. Small business teams might discuss sales data during their daily stand-up, while larger teams might review reports in greater detail at the end of the week.
As long as you’re reflecting on which data you share and why you’re sharing it, you’re on the right track.
Translate your data into actionable steps
Turning your sales data into clear next steps means that your team knows exactly how to improve performance.
The end goal should be action on behalf of your team. Maybe that means rethinking your call volume or investing more in a certain channel.
Either way, you’ll never know what to do next until you talk about your data. That means establishing clearly defined next steps and priorities based on your knowledge.
Beyond simply sharing a templated sales report, your team is responsible for answering the following:
Are we on track to reach our sales goals?
If not, what changes do we need to make? If so, what are we doing well?
How can we have better conversations with our customers?
With these questions in mind, you can point toward action items to guide your sales strategy moving forward.
Tools to create the best sales reports
The right sales reporting tools help you move beyond spreadsheets and generate faster, more accurate insights that support better decision-making.
As a company grows, working from spreadsheets gets complicated quickly. Creating insightful, timely sales reports is infinitely easier with purpose-built tools, which is where a good CRM comes into its own.
A CRM centralizes all your sales data, automatically tracking activity across the pipeline and turning raw information into clear, real-time reports.
In Pipedrive, for example, you can:
Track deals visually through your pipeline. Deals move through clearly defined stages from start to close. This visibility shows deal progress at every point and highlights where opportunities are stalling.
Build sales dashboards for your KPIs. Key metrics are displayed in a single, central view that updates in real time. Sales performance becomes easier to monitor without switching between reports.
Log sales communication and activities. Sales activities are captured as they happen. As a result, reporting remains accurate without manual updates.
Generate sales reports for individuals, teams and overall performance. Performance data breaks down by rep, team or pipeline stage. Sales output becomes easier to compare and review.
Forecast revenue based on pipeline value and conversion rates. Future sales projections use current deal data and win rates. Revenue planning reflects actual pipeline performance rather than guesswork.
Watch this video for a breakdown on how to forecast sales and revenue with Pipedrive:
With these actionable insights, you can monitor performance, forecast revenue and identify where deals aren’t converting in the customer journey.
You’ll also want a CRM that combines detailed sales reporting with a simple interface so sales teams can easily find insights, update data and use the reports in day-to-day decision-making.
Final thoughts
Sales reporting is an absolute must for growing businesses, providing insight into performance, pipeline health and the actions that drive revenue.
Use the free sales report templates in this article to turn raw sales data collection into clear reports that highlight what’s working, what’s not and what needs to change to get the best results.
To make reporting even easier, use Pipedrive’s CRM to track sales activity automatically and generate real-time sales reports without the manual work. Start your free 14-day trial today.


