“Big data” has transformed the way businesses operate. With more market research available at our fingertips than ever before, a lack of data is no longer the issue.
The challenge now is figuring out how to filter and use the data to optimize your customer experience and business decision-making.
Luckily, there are steps you can take to ensure your reporting data is accurate and usable across the organization.
In this article, we’ll go over four steps to turn data into actionable insights you can use to improve your sales performance.
Download Your Guide to Sales Performance Measurement
1. Define clear objectives
Take the time to think about what your business needs and objectives are before attempting to turn data into actionable insights. Otherwise, you could waste time, energy and resources measuring and acting on the wrong results.
The most effective sales goals are specific, measurable, attainable, realistic and time-bound (also known as SMART goals):
Specific. The narrower you can make the goal, the easier it will be for teams to see how to achieve it.
Measureable. Make sure you can tie a metric to the goal and track it.
Attainable. Goals that aren’t outside the realms of possibility will keep teams motivated.
Realistic. Align your goals with the goals of the wider organization.
Time-bound. Set a time limit so team members know when time is up.
For example, “increase sales qualified leads (SQLs) by 15% this quarter” will serve you better than “increase revenue this year”.
Avoid setting lofty ambitions simply to impress stakeholders and decision-makers. If you do have ambitious goals, be sure to break them down into a step-by-step plan on how to achieve them with tangible, smaller milestones.

2. Choose your KPIs and establish benchmarks
After you figure out what you’re trying to achieve with your sales data, it’s time to choose your key performance indicators (KPIs) and establish benchmarks from existing data sources. This step will help you stay focused on metrics that matter and gauge success.
Choosing your KPIs is about asking the right business questions about what drives revenue (directly or indirectly).
For example, getting more likes on social media might seem like a worthwhile goal. In reality, “going viral” usually means that more people outside your target audience have seen your content. Instead of going for vanity metrics, such as “likes”, you could opt for something more tangible, like click-throughs from social media.
A large part of choosing your KPIs will depend on which channels you use and where you want to focus in the customer journey.
Which channels do you use?
The best metrics to choose will also depend on which channels you market and sell through, and what specific action you want leads and customers to take.
Engagement could be a useful KPI for brand awareness social ad campaigns, conversions will likely be an important metric for sales pages and signups will be relevant for your email marketing reports.
Poorly performing touchpoints won’t always be in need of a total operations overhaul. Improving performance can be down to many problems, like algorithm updates, technical issues (e.g. a post isn’t going live at the set time) or messaging (e.g. the headline didn’t resonate with the customer).
Choosing the right metrics for the right channel will help you understand where to make improvements.
Where in the customer journey do you want to focus?
Your metrics will differ depending on the channels you use, but they’ll also vary by where you’re focusing in the customer journey.

For example, your KPIs will look different for tracking leads at the starting point with your brand versus those focusing on keeping existing customers happy. In the former situation, you’ll likely want to measure things like engagement, downloads and interactions.
In the case of customer retention, you’ll want to measure things like CSAT (customer satisfaction) scores, repurchases and time to repurchase.
What about qualitative data?
Don’t shy away from qualitative data (e.g. interviews and open-ended questionnaires). The process of collecting information beyond hard numbers and demographics can require more legwork but it can provide relevant information that can save you months of guesswork and testing.
For example, whether you’re a service provider or sell products, you can glean actionable results from qualitative feedback relating to customer experience. Customers often reveal motivations, attitudes and pain points that marketing and sales teams just haven’t thought of (and thus couldn’t include in a multiple choice survey).
Perhaps a respondent revealed in an interview that the situation has changed for them since the pandemic and they now prefer to communicate with their team completely asynchronously. If you’re in the business of providing communication software, this is extremely important and, once validated in other ways, can inform marketing, product development and more.
These insights are not often the type of data points you get in a reporting dashboard, but they can be critical for informing necessary pivots. They also give you clues into the way customers talk about your product and their pain points, so salespeople can help future customers using their natural language.
If you haven’t already, map out your customer journey stages, making any necessary pivots based on your qualitative customer feedback. From there, determine your KPI benchmarks and goals by stage and by channel.
3. Streamline and automate your data collection
Once you’ve determined which metrics are most important, it’s time to create efficient systems to collect datasets from various sources and transform them into something you can analyze.
The goal is to generate insights and uncover the stories behind the numbers, but sifting through raw data and spotting patterns can be time-consuming.
Automation is a business intelligence system that can save you that time in the long run. Once set up, automated data analytics and reporting systems can streamline your data collection efforts and paint a picture for you.

The functionality of data reporting tools varies. The KPIs you choose will impact what analytics tools, types of data reports and customer relationship management (CRM) system you should invest in.
For instance, you may be interested in increasing your average deal value. A visual overview of your data analysis can help you identify which activities lead to bigger deals and which activities are bottlenecks to closing.
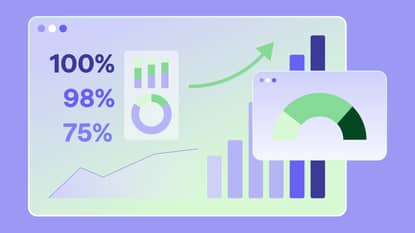
Pipedrive’s customizable sales dashboards give you clear data visualization, so you can track performance in real time. Your data analysts can share graphs from Excel spreadsheets, but automating this task and placing it right on your reps’ dashboards can be a motivating and productive strategy.
Ask for feedback and refine your process
The next step is to get feedback from your team and iterate. Your team will need to understand how to implement your reporting data, and the most effective data analysis systems are always evolving.
Asking the following questions about the data reporting process and its impact will help you improve:
Is it clear what data you’re looking at?
How do you use data to inform your sales strategies?
Does the information help you gain the insight needed to do your job better?
Are you seeing improvements to your workflow based on this data?
Do you believe the new process is sustainable?
Do you have any feedback for further improvements?
Your team are the people on the ground, putting your actionable insights to work and implementing the changes. Revisit your analysis methodology regularly and get feedback from your salespeople with template employee surveys to continually optimize your operations.
4. Forecast trends accurately with data history and context
You may already have a wealth of untapped data which you can use to set goals, make predictions and inform you of new results.
Data becomes meaningful when put into context and past performance has a lot to tell us about the future. Predictability in sales comes from accurate forecasting and you can’t forecast without knowledge drawn from previous data analysis reports.
Without context, you may risk drawing inaccurate conclusions from your data, which can negatively impact business decisions. To mitigate this, form a hypothesis and test it with a small group before implementing organization-wide changes.
Keeping context in mind when establishing reporting time frames is also important. Monthly or quarterly comparisons work for some businesses whereas an annual report cycle is better for others that are heavily influenced by fluctuating seasons.
For example, Q4 is incredibly important for most businesses. In the last quarter of the year, many sales teams are trying to make up for missed opportunities in a short period of time. With the holidays and Thanksgiving, the fourth quarter of the year is also shorter than other quarters.
This is important information to keep in mind when examining your team’s performance. If you implemented new initiatives or tactics for Q4 and the marketing report or sales report isn’t reflecting an improvement in your KPI, your data analysis won’t be accurate without context.

Final thoughts
The proliferation of data over the last decade has been a gamechanger for sales, helping reps and leaders make data-driven decisions. At the same time, too much data can be overwhelming.
Avoid the curse of “needing more data” by getting clear on what it is you’re trying to achieve, choosing KPIs that contribute to revenue and making sure you can communicate your insight effectively to your teammates and stakeholders.