When your business offers several products or services, it’s crucial to decide where to focus your time and money. A framework for comparing different parts of your business brings the clarity you need to make confident decisions.
In this article, you’ll learn how the GE McKinsey Matrix helps. You’ll get a step-by-step guide to building your own matrix and see how it points you toward the best areas to invest, maintain or rethink.
What is the GE McKinsey Matrix?
The GE McKinsey Matrix is a framework for helping companies decide where to invest their money and effort.
McKinsey & Company, a global management consulting firm, developed the matrix for General Electric (GE). Today, hundreds of companies use this systematic approach to evaluate strategic business units (SBUs) like services, customer segments, regions or product lines.
The end goal is to figure out which ones have the best chance to succeed and which are doing well right now. The matrix uses a grid with nine boxes, like this:
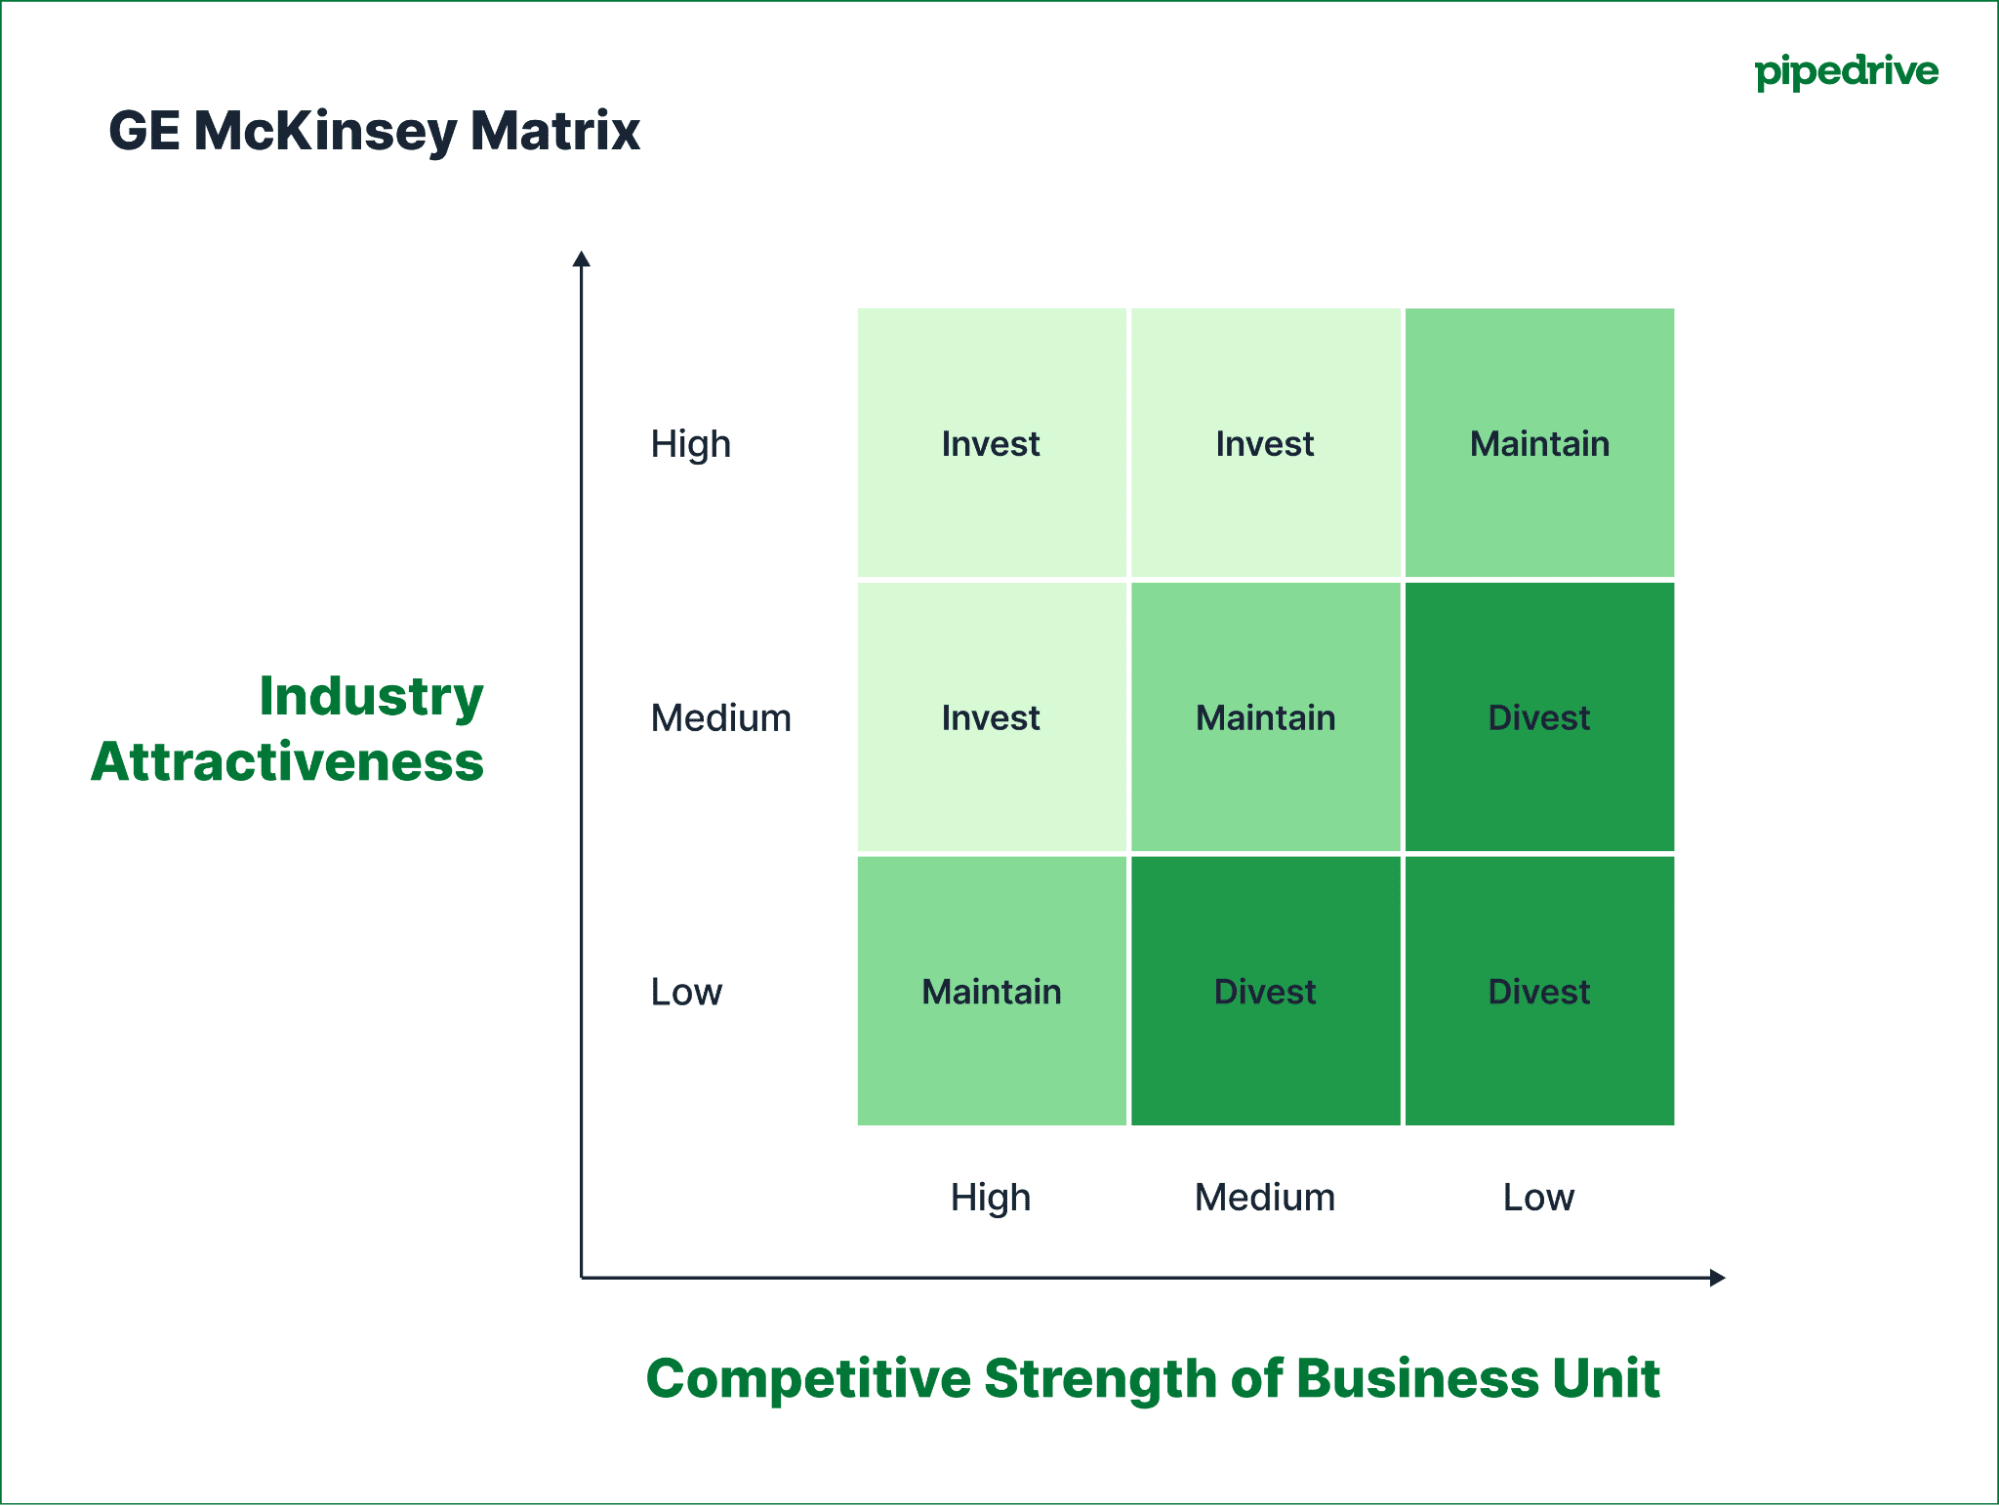
To use the matrix, rate each business unit along two axes, giving it a ranking of low, medium or high. Here’s what the two axes mean:
Y-axis (vertical axis): industry attractiveness | X-axis (horizontal axis): competitive business unit strength |
This asks:
| This asks:
|
The two axes combine to help guide strategic business decisions:
If a business unit sits in a high industry attractiveness and high competitive strength position, it’s best to invest and grow. These areas have the most potential and are where the company is well-positioned to succeed.
If it lands somewhere in the middle, such as a strong competitive position in an unattractive industry, it needs careful judgment. Sometimes it’s worth maintaining one’s position, sometimes it’s worth trying to strengthen the business.
If a business unit is in a low industry attractiveness and low competitive strength position, it’s usually best to divest or exit. These areas have limited opportunities for business growth or improvement.
While the GE McKinsey Matrix helps business owners clarify where to focus their efforts, it may not suit every business. In the next section, you’ll decide if it makes sense for you.
Does your business need the GE McKinsey Matrix?
McKinsey originally designed the GE McKinsey Matrix for large corporations. However, in the right situation, it can be just as useful for small and medium-sized businesses (SMBs).
Use the table below to see if the matrix can support your small company:
The GE McKinsey Matrix is a good fit if… | It might not be the best fit if… |
You have multiple distinct products, services or business lines. | You only offer one or two products or services. |
You want to allocate resources strategically across different areas. | You don’t need to make big choices about where to focus at the moment. |
You’re planning for growth or diversification and want to spot sales opportunities. | You lack market research or reliable data on your competitive position. |
You need a structured, visual approach to compare markets and business strength. | You prefer to make strategic decisions based on simpler methods or financial reports. |
You’re looking for a clear overview to guide strategic planning. | The matrix feels quite complex or time-consuming for your team right now. |
If the matrix seems like a strong match for your business, here are some of the benefits you’ll reap:
It helps you manage limited resources. When time or money are tight, the matrix shows where to focus first so you don’t spread yourself too thin.
It promotes better decision-making. Instead of guessing, you look at real data to figure out which parts of the business deserve more attention.
It gets everyone on the same page. The matrix gives leaders a shared view of what matters most, making it easier to agree on the next best actions.
It breaks down complex decisions. If you offer different products or work in different markets, the matrix helps turn that complexity into clear, practical choices.
Once you’re confident the GE McKinsey Matrix is right for your business, create one of your own.
Note: The Boston Consulting Group (BCG) Matrix (or the Growth-Share Matrix) is another strategic planning tool you could consider. It focuses on market growth and market share to help you prioritize investment decisions and manage cash flow.
Step-by-step: how to build a GE McKinsey Matrix
While creating a GE McKinsey Matrix requires some preparation, it’s straightforward once you break it down. Follow these five steps to put it into practice.
1. Define your business units or product lines to get a clear picture
Before you can use the GE McKinsey Matrix, you need to get clear on which parts of your business you’re evaluating. For SMBs, this usually includes product lines, services, customer segments and regions.
Look at how you currently organize your business activities. For example:
Do you track revenue separately for different product lines?
Do you run marketing campaigns with specific customer segmentation?
Do you report sales performance by region?
If so, these are distinct areas of your business that you can use as business units. The key is that each unit should operate somewhat independently and could, in theory, succeed or struggle without directly impacting the others.
A customer relationship management (CRM) tool like Pipedrive makes this process clearer. Pipedrive’s deal labels feature lets you assign color-coded labels to each deal, so you can group and filter your deals by different categories.
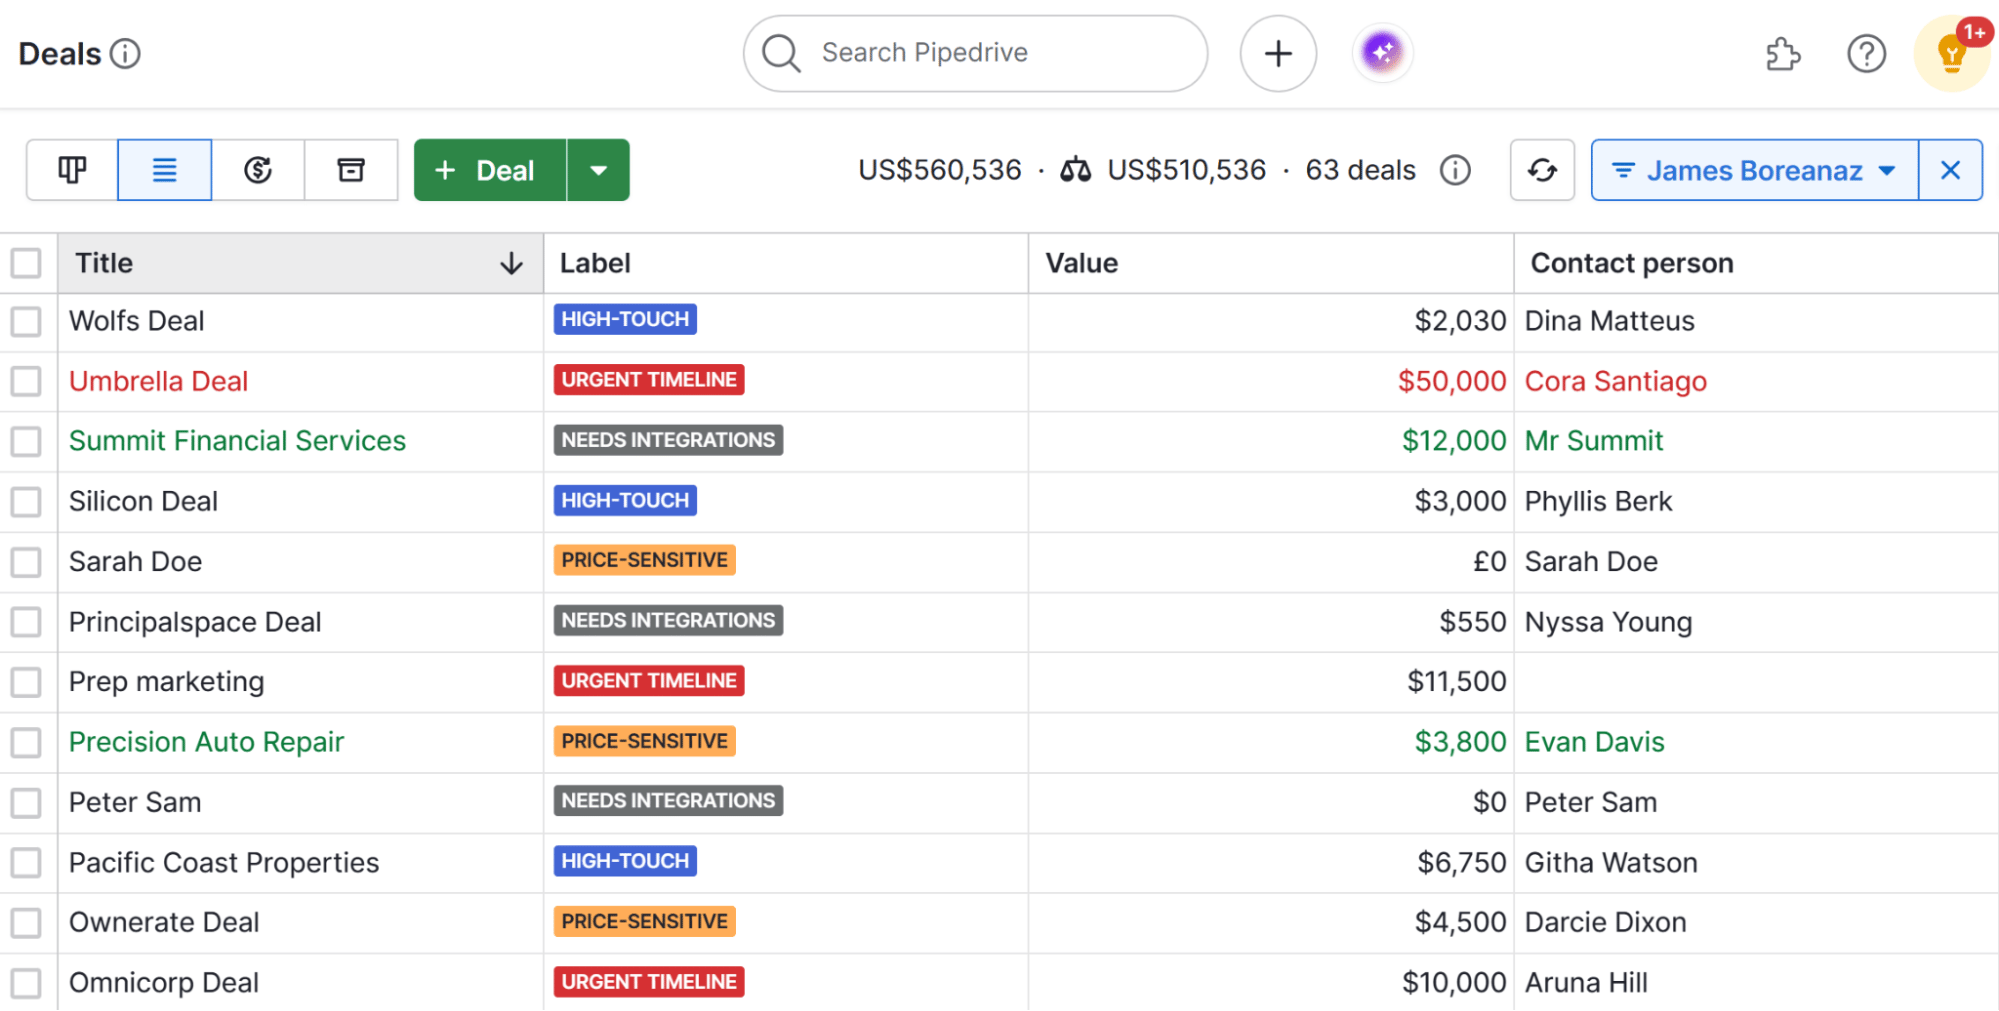
The labels give you a quick visual overview of where your sales come from. It makes it easier to identify distinct business units to evaluate in the matrix, without having to guess or rely on messy spreadsheets.
Example: A B2B commercial furniture manufacturing company might label sales for different product lines like “Office Furniture for Corporates”, “Home Office Chairs” and “Workplace Accessories for Resellers”. Labels provide a simple, structured way to view product lines as business units within the matrix.
2. Assess industry attractiveness to see where there’s room to grow
Now that you’ve defined your business units, it’s time to assess how attractive each unit is in the market (where it sits on the Y-axis).
This doesn’t mean how well that unit is doing in your business. Rather, it’s about whether the market itself offers good potential for growth and profit.
For each business unit you identified, answer these questions to assess market attractiveness:
How big is the market? Look for industry reports or market research to estimate the total market size and potential.
Is the market growing, shrinking or staying the same? Check sales forecasts and recent trends in your sales data. A steady stream of new leads might suggest growth.
What’s the average profitability for businesses in this space? Look at industry benchmarks and your own revenue reporting to judge typical profit margins.
How competitive is it? Look at the number and strength of competitors and market share data. Check if competitors are fighting for share through heavy discounts or pricing promotions.
How easy is it for new competitors to enter? Consider barriers like regulation or cost. Gather customer feedback to show if buyers are open to switching providers.
Besides looking at the data, talk with your sales and marketing teams. They often have a good sense of which business units are thriving and which feel stagnant.
Download Your Sales and Marketing Strategy Guide
Pipedrive’s Insights feature helps you create reports on how different products or services are performing. Here’s what reporting looks like in the CRM:
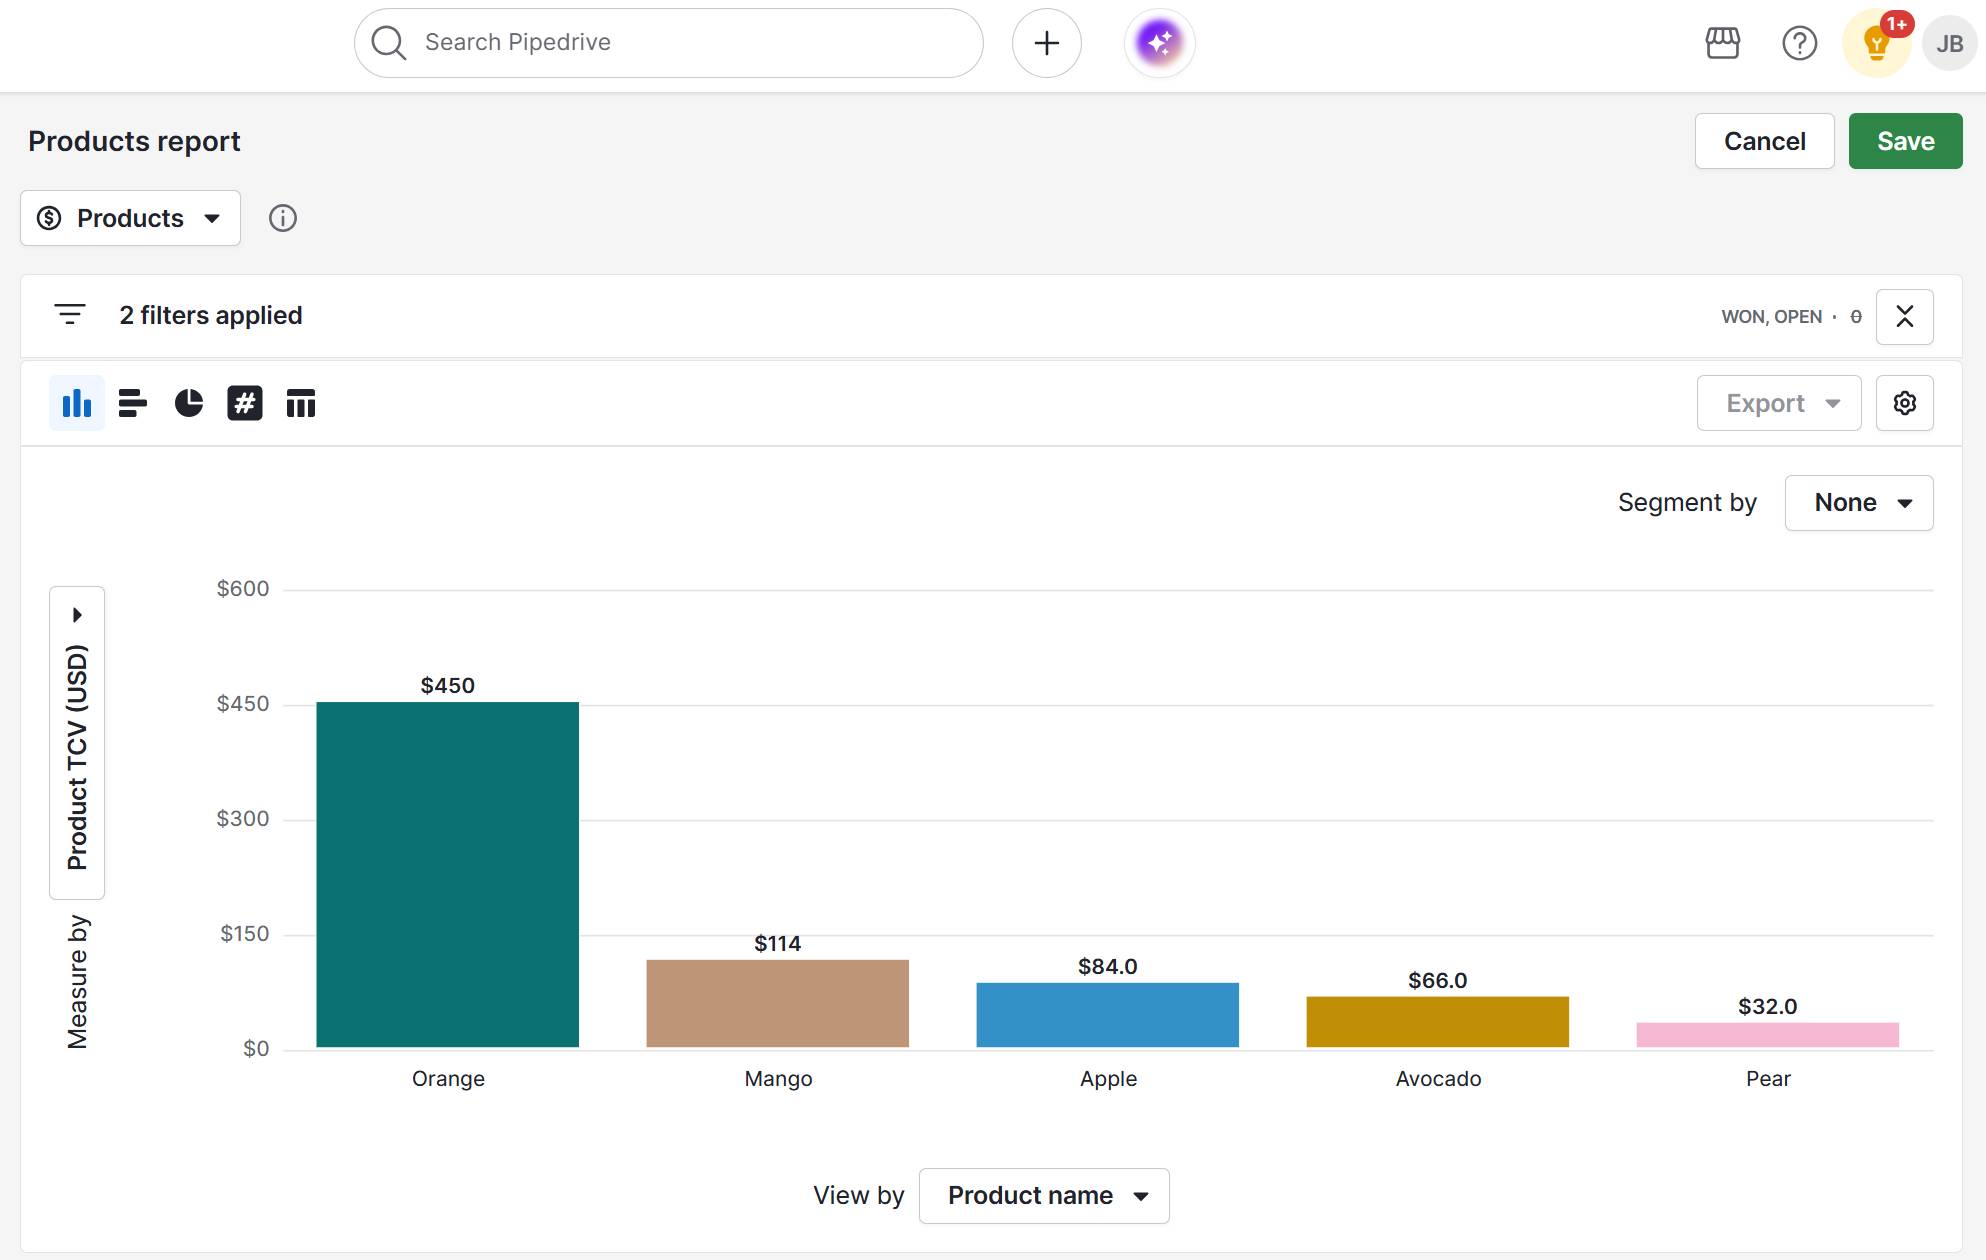
Pipedrive’s insights and reporting functionality lets you see sales volume, total contract value and revenue trends at a glance.
Example: The furniture manufacturer uses Pipedrive Insights to find that home office chairs have increased sales to retail chains and driven good profit margins from bulk orders. Using this data, plus customer feedback and market research, it determines that home office chairs rank high on the attractive industry axis.
3. Gauge competitive strength to understand your position in the market
Now, it’s time to assess the competitive strength of each business unit (where it will sit on the X-axis).
In step two, you analyzed external market conditions affecting your business units. Now, use that same data to determine how well-positioned your company is to support each business unit’s success.
Answer:
How strong your brand equity? Use customer surveys and repeat purchase rates to gauge satisfaction. Ask your sales team if customers accept your prices or frequently ask for discounts – showing how much value customers place on your brand.
How loyal are your customers? Measure customer retention rates and how often people make repeat purchases. Customer loyalty suggests solid brand strength and may signal a sustainable competitive advantage.
What is your estimated market share? Compare your sales volume against industry reports or total market size estimates to approximate your share.
How efficient are your operations? Review profit margins to see how efficiently you manage costs and pricing. Higher margins often mean you operate efficiently or have pricing power, supporting a stronger competitive position.
How well does your sales team perform? Look at deal win rates and conversion rates to understand how effectively you close sales compared to past performance or targets.
Pipedrive’s deal conversion report provides detailed insights into how your deals progress through the sales pipeline.
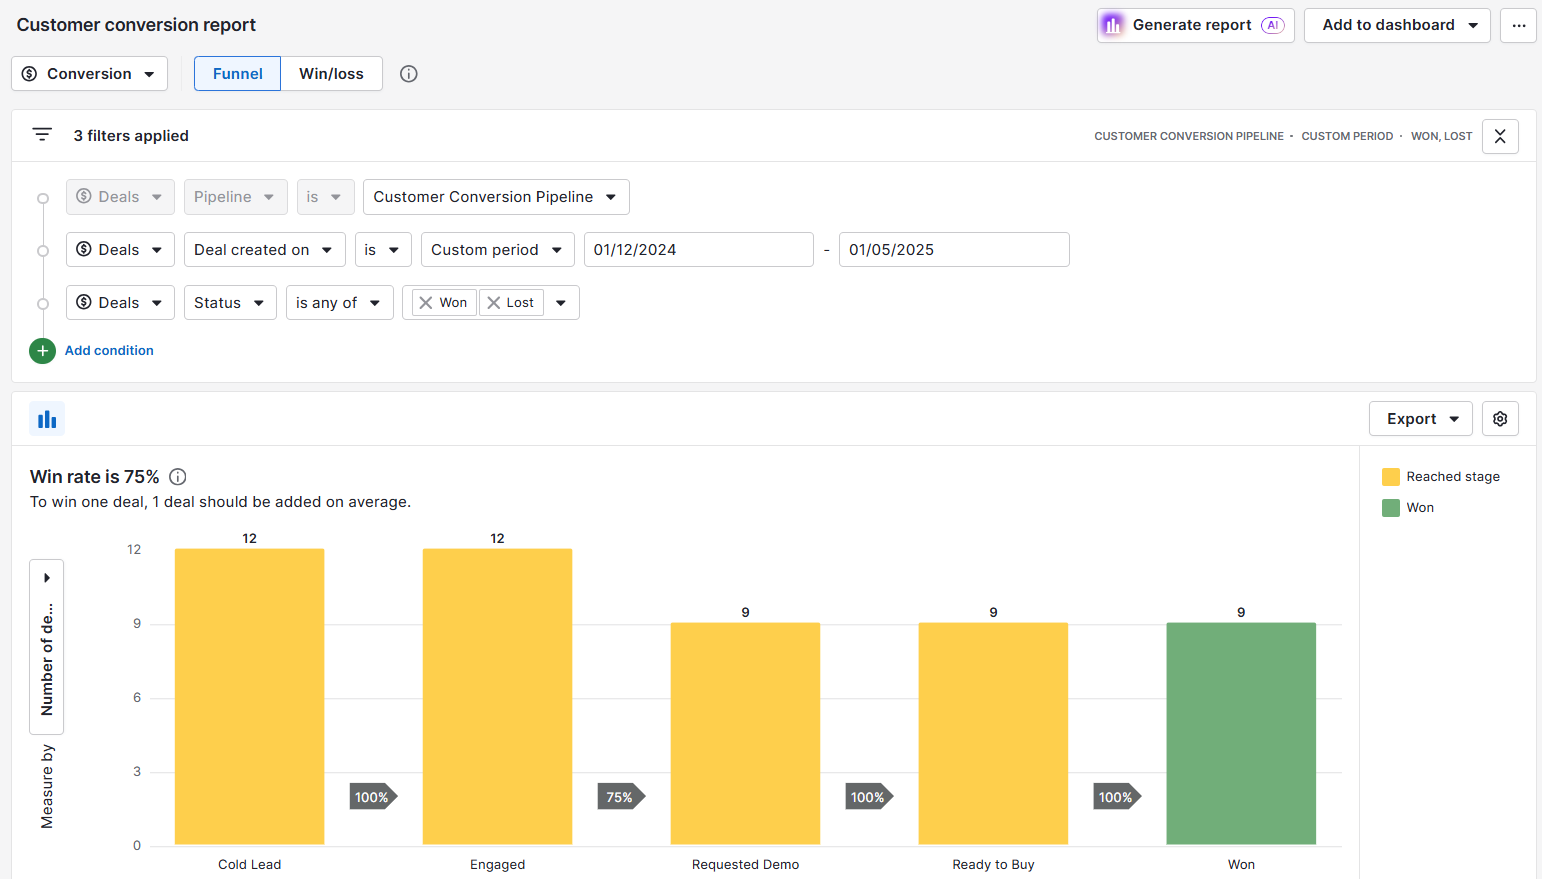
The report helps you spot strengths and weaknesses in your sales process, giving a clearer picture of your business unit’s competitive position.
Example: The furniture brand uses Pipedrive’s Deal Conversion report to see that home office chairs frequently exceed wholesale sales objectives. Feedback from resellers also indicates strong demand for this product line. Using this data, the company concludes that home office chairs rank as high on the competitive strength axis.
4. Plot each business unit on the matrix to visualize your findings
Next, place each business unit on the matrix according to your scores for industry attractiveness and competitive strength. This visual helps you quickly see the strength of a business unit and which units need attention.
In the furniture company example, the manufacturer ranked home office chairs high in each category, so this business unit goes in the top left grid.
Say it has also assessed office accessories, ranking it as medium for industry attractiveness but low for competitive strength. This business unit would go in the middle grid on the right column.
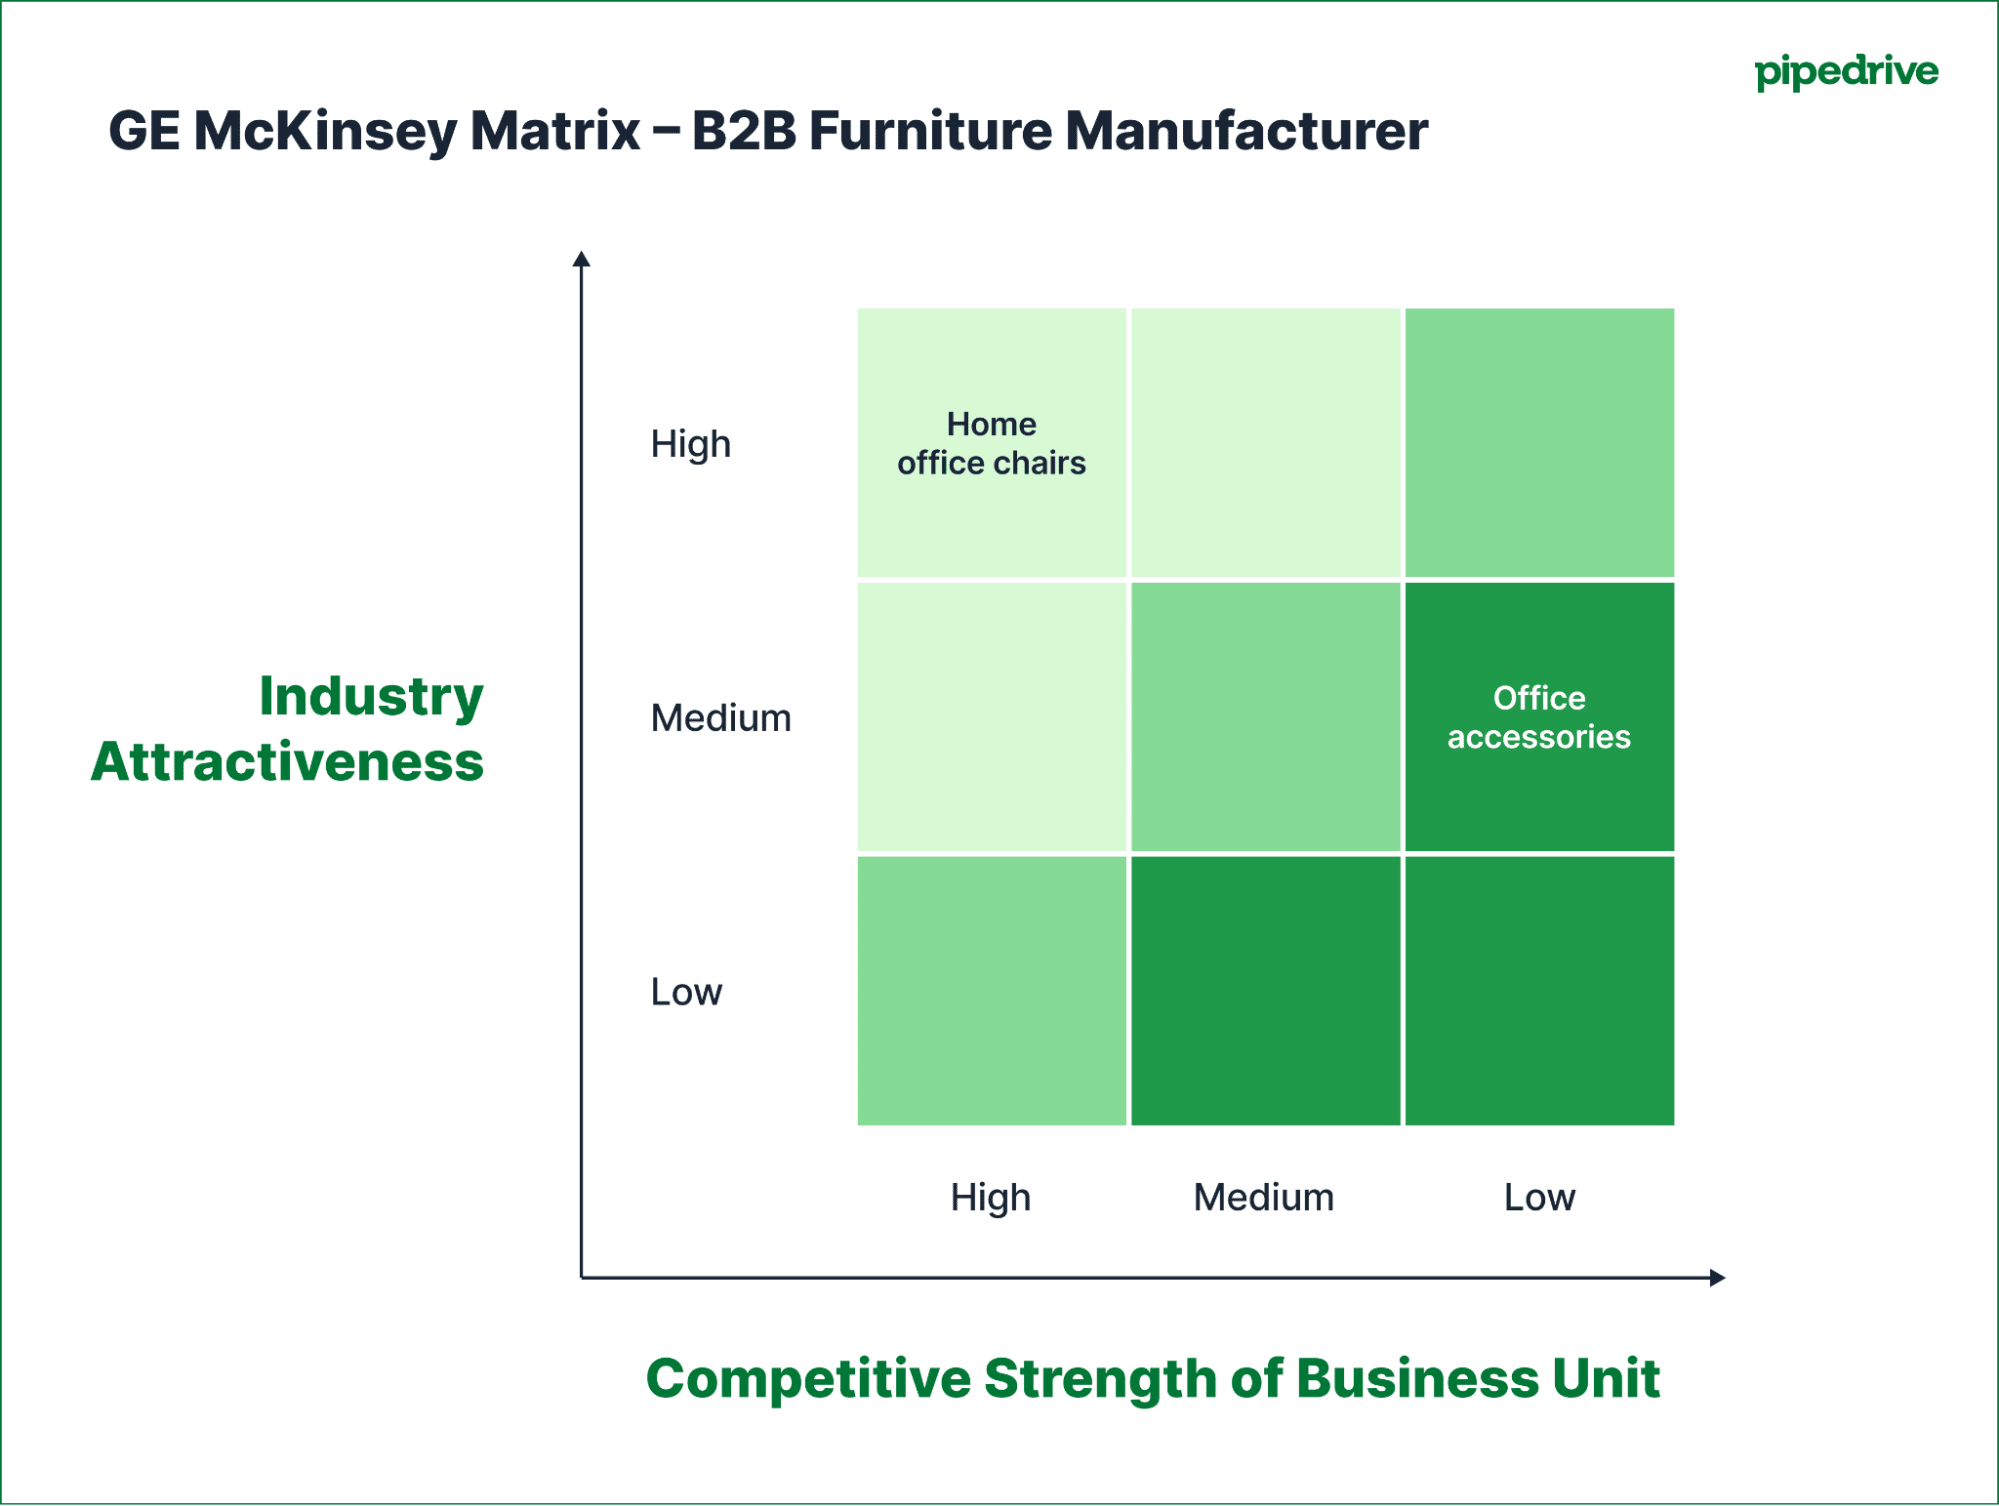
It’s fine if multiple business units land in the same grid. Just label them clearly so it’s easy to see what’s what. To keep your matrix easy to understand and avoid crowding, it’s best to create separate grids for different types of business units.
Example: If the furniture manufacturer also wants to look at customer segments, it can set up an additional matrix rather than try to add to the product line grid.
5. Analyze placement and prioritize your next actions
After plotting your business units on the matrix, it’s time to interpret their positions and strategic implications. Here’s what each area generally means for your business strategy:
Top-left (high industry attractiveness, high competitive strength) units are your best opportunities. Focus investment here to grow and strengthen your market position.
Bottom-right (low industry attractiveness, low competitive strength) units usually drain resources with little chance to improve. Consider divesting or exiting these areas.
Middle or mixed position. For units that fall between extremes, carefully evaluate whether to maintain, improve or selectively invest depending on your goals and resources.
Example: To capitalize on home office chairs’ high ranking on both axes, the furniture firm invests in co-branded marketing campaigns with resellers targeting remote teams. It expands its product portfolio with new designs to capture more market share and grow profitability.
Office accessories fall in the middle zone: medium industry attractiveness but low competitive strength. The manufacturer focuses on improving product quality and customer support for resellers.
Whatever your plan of action, the ultimate measure of success is how these units perform in the market. Pipedrive’s pipeline view shows how well your sales strategy translates into customer actions.
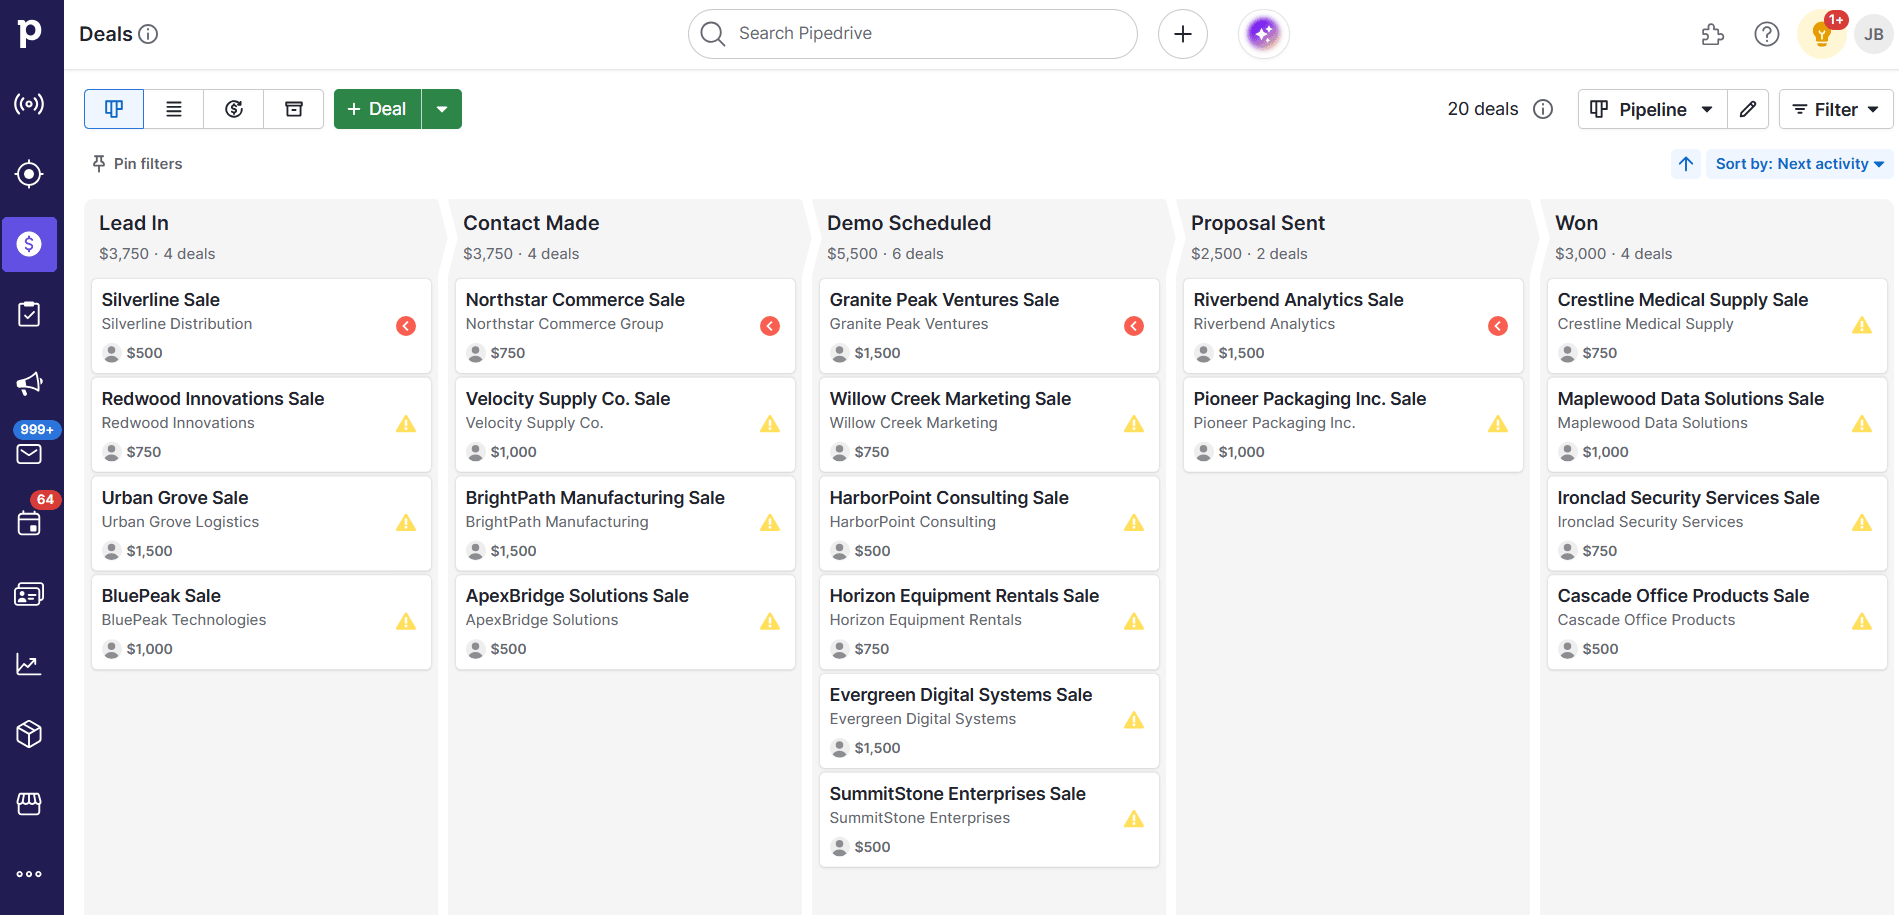
Using deal labels to tag business units lets you filter the pipeline by those specific units, helping you monitor sales progress related to each priority area from your matrix.
Real-time visibility shows you when to adjust tactics if sales don’t align with expectations, keeping your strategic plan grounded in real results.
Pitfalls to avoid with the GE McKinsey Matrix
Even with a clear process, there are common pitfalls that can make your GE McKinsey Matrix less useful. Here’s what to watch for and how to avoid wasting time or making poor decisions:
Pitfall | How to avoid it |
Overcomplicating the criteria |
|
Using poor or subjective data |
|
Failing to update the matrix |
|
Assuming the matrix gives perfect answers |
|
By overcoming these risks, your GE McKinsey Matrix can act as a strategic tool that makes reaching your business goals easier, not more complex.
Note: No single framework can perfectly cover every angle. To strengthen your portfolio analysis, consider using others such as Porter’s Five Forces, PESTEL and value chain analysis to get a fuller picture of your company’s core competencies.
Final thoughts
The GE McKinsey Matrix gives you a clear, structured approach to portfolio management and resource allocation. It helps you balance factors like market growth rate, industry profitability and competitive intensity so you can focus on the areas most likely to strengthen your business portfolio.
Planning is just the first step. Pipedrive helps you put those plans into action by giving you visibility over your sales pipeline and helping you track company progress. Start your free 14-day trial to set your road to success in motion.


