Many businesses track vanity metrics like social media followers or website traffic without asking whether those numbers actually reflect how customers feel or act.
While these figures can look impressive on a report, they don’t show if people are truly connecting with your brand or moving closer to becoming loyal customers.
The solution is focusing on customer engagement metrics that measure meaningful interactions and their impact on business outcomes.
In this article, you’ll learn what customer engagement metrics are, why they matter and which ones to track across marketing, sales and support. You’ll also discover how to measure and optimize them using practical tools and proven strategies.
Key takeaways from customer engagement metrics
Customer engagement metrics show how actively and meaningfully people connect with your brand across touchpoints.
They offer insights into customer behavior, campaign effectiveness and areas for improvement in the customer experience.
Optimize customer engagement metrics to optimize customer satisfaction, increase retention and drive revenue growth.
Use Pipedrive’s CRM to track and visualize key metrics in customizable dashboards – sign up for a free trial today.
What are customer engagement metrics?
Customer engagement metrics measure how people interact with your business across different touchpoints.
They go beyond counting clicks or followers, showing the quality of those interactions and how they contribute to business goals like customer retention, loyalty and conversions.
For example, if someone opens your marketing emails but never clicks through, that’s activity, but not engagement.
A better metric might be click-through rate (CTR) paired with follow-up completion rate in your CRM, showing whether those leads turn into conversations and ultimately deals.
What is customer engagement? It’s the process of building ongoing, meaningful relationships by providing value and interacting regularly with customers. Tracking the right metrics helps boost engagement.
Why tracking customer engagement matters
Customer engagement metrics offer early signals of how customers perceive your business. In 2025, those signals are more critical than ever.
According to KPMG’s Global Customer Experience Excellence Report, customer experience scores dropped by 3% in 2024, with empathy and expectations falling by 4%.
This decline shows a growing disconnect between what businesses deliver and what customers expect.
In this climate, tracking engagement with the help of customer engagement platforms is essential. It’s how you detect dissatisfaction, optimize interactions and keep engaged customers loyal before they quietly walk away.
Engagement metrics help you:
Spot friction before it affects retention. Metrics like customer effort score (CES) and product adoption rate reveal where customers struggle and when they disengage.
Prioritize actions with real impact. Unlike vanity metrics, engagement KPIs tie directly to outcomes like renewals, upsells and customer lifetime value.
Create connected customer journeys. Shared engagement data gives marketing, sales and support teams a unified view of where to intervene.
Act in real time. Monitoring engagement trends as they happen allows teams to respond quickly, re-engaging customers before interest drops or churn risk increases.
Align strategy with customer expectations. Engagement insights show whether your campaigns, processes and interactions match customers’ wants.
Customer engagement metrics allow teams to improve experiences and build lasting customer relationships when tracked consistently.
Did you know? Pipedrive’s AI Engagement Score (currently in beta) is one way to measure customer engagement across your CRM.
It evaluates customer interactions in real time, helping sales and customer success teams see which customers are most engaged and which need re-engagement strategies.
Understanding these aspects of customer engagement makes it easier to align marketing strategies, sales efforts and customer experience improvements toward a common goal.
Core customer engagement metrics to track
Customer engagement happens throughout the journey, from first touch to long-term loyalty.
Tracking key customer engagement metrics with the right customer engagement tools helps you understand whether people are interacting with your brand and whether those interactions are creating value for your business and your customers.
Over a given lifecycle or period of time, these metrics reveal the percentage of customers moving from brand awareness to advocacy.
The following metrics give insight into how well you build relationships, deliver on expectations and drive outcomes like retention and satisfaction.
Use them to evaluate what’s working, where engagement drops off and how to improve across marketing, sales and support.
Download our customer journey map template
Net Promoter Score (NPS): measuring brand advocacy
Net Promoter Score (NPS) is a widely used customer engagement metric that measures how likely customers are to recommend your business to others.
It’s based on a single survey question: “How likely are you to recommend us to a friend or colleague?” rated on a scale from 0 to 10.
Promoters (9–10): Loyal customers who are enthusiastic and likely to refer others
Passives (7–8): Satisfied but unenthusiastic customers who may switch to a competitor
Detractors (0–6): Unhappy customers who can damage your brand through negative word-of-mouth
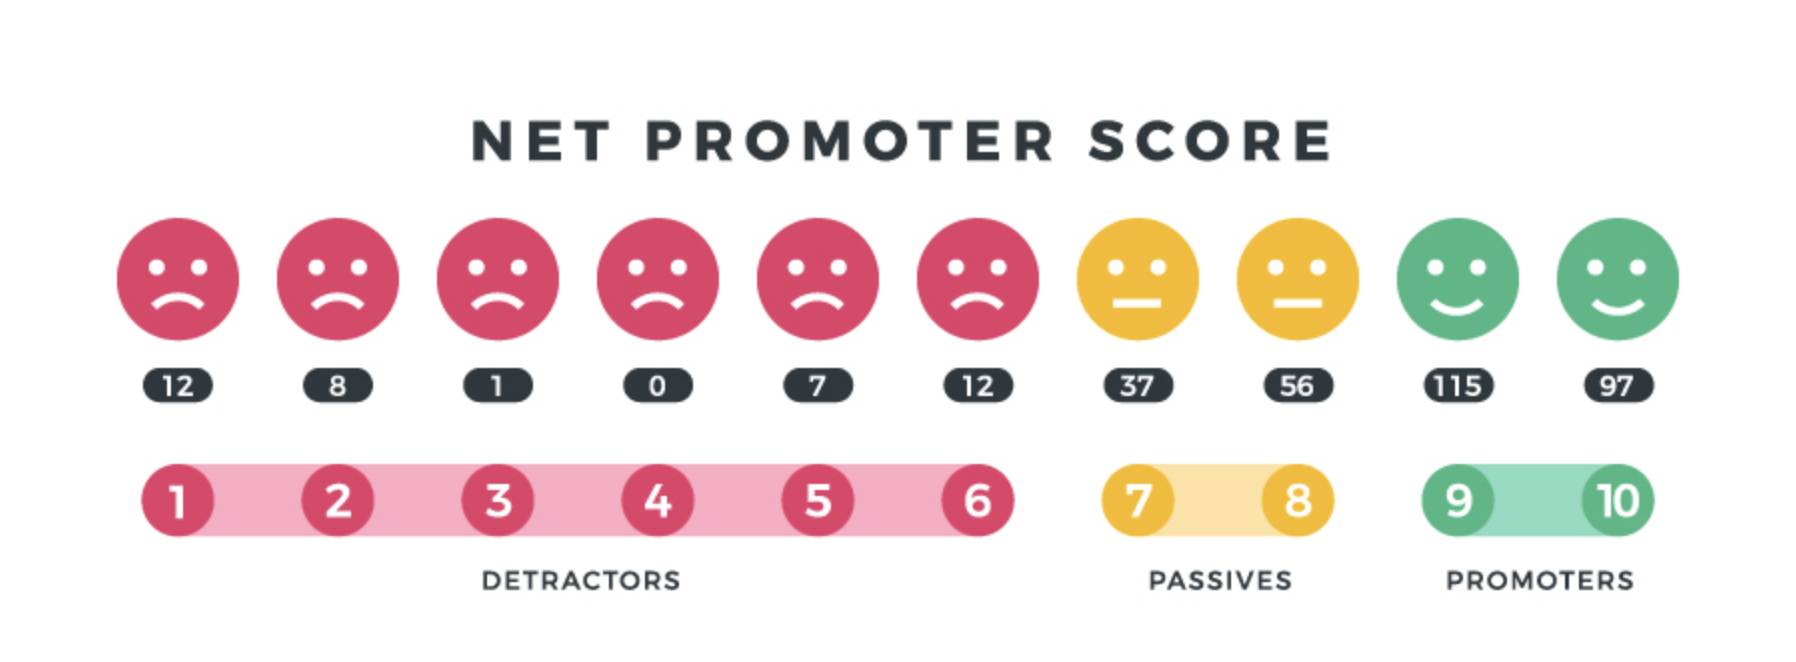
Your NPS is calculated by subtracting the percentage of detractors from the percentage of promoters. The score ranges from −100 to +100.
A score above 0 is considered good
Above 30 is strong
Anything over 50 is excellent
A negative score signals serious issues in customer satisfaction and loyalty
You can gather NPS data through email, in-app surveys and post-interaction feedback tracking and integrate it into your CRM to identify patterns and inform your customer engagement strategies.
Customer Satisfaction Score (CSAT): gauging service quality
Customer Satisfaction Score (CSAT) measures how satisfied customers are with a specific interaction, product or experience. It’s one of the most straightforward ways to assess customer experience quality at key touchpoints like onboarding, support or post-purchase.
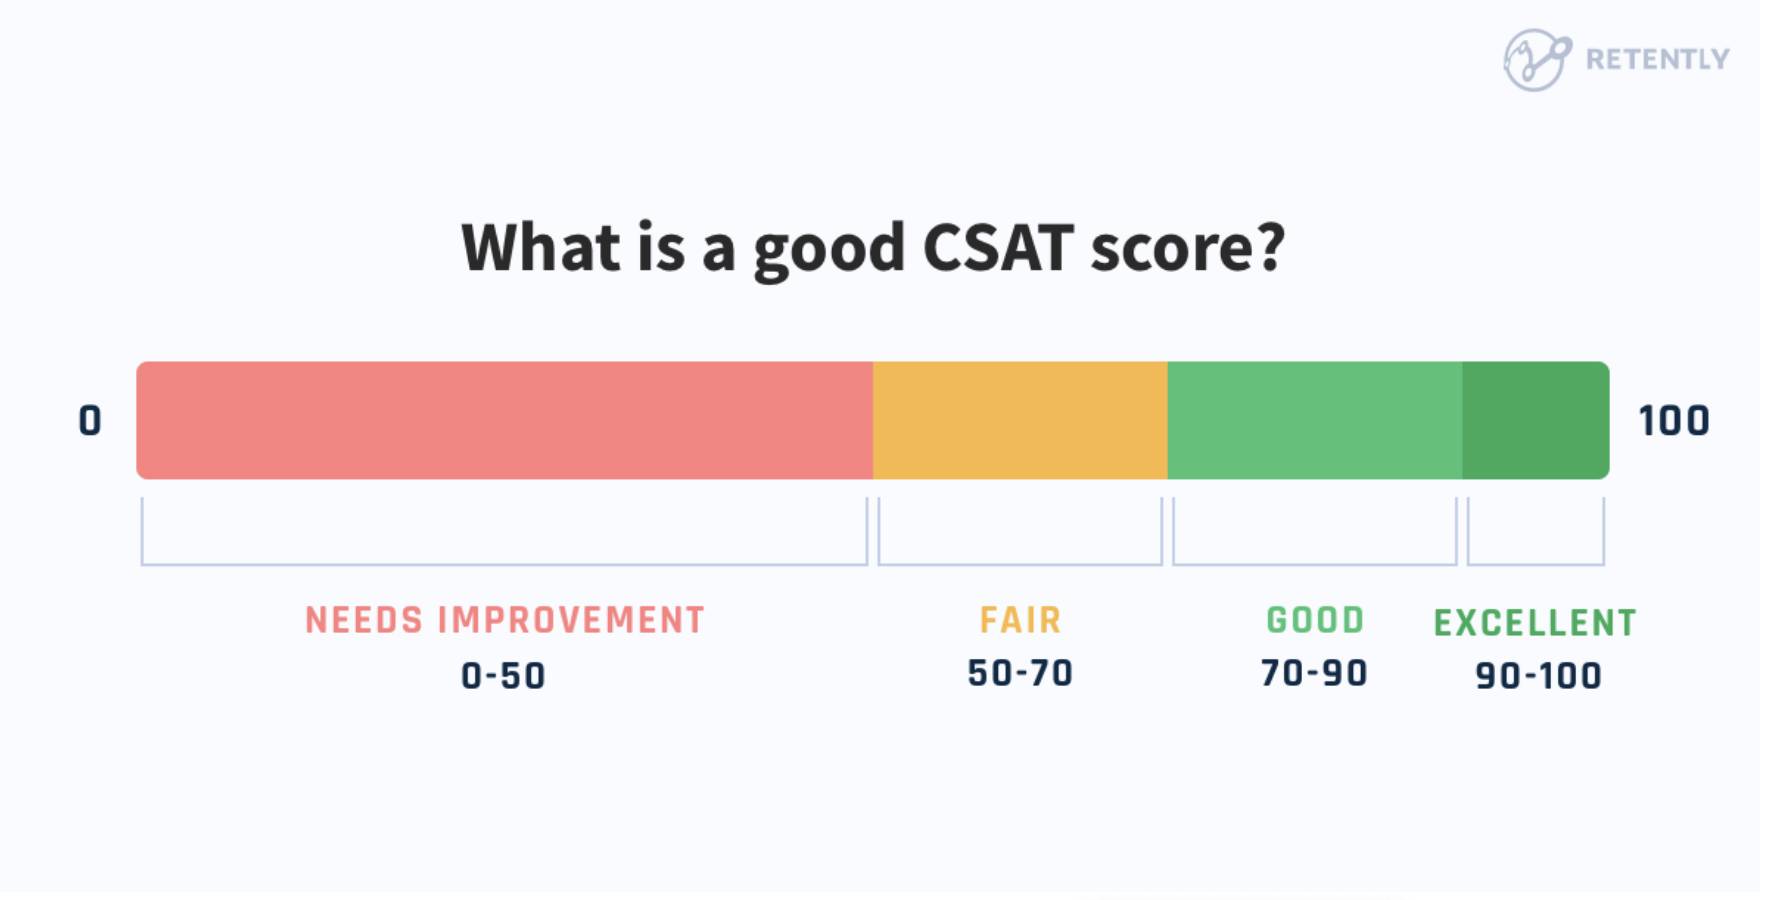
CSAT is typically collected by asking a simple question, such as: “How satisfied were you with your experience?”
Respondents rate their satisfaction on a scale from 1 to 5, where:
1 = Very dissatisfied
5 = Very satisfied
Your CSAT score is calculated by dividing the number of satisfied customers (those who select 4 or 5) by the total number of responses, then multiplying by 100 to get a percentage:
CSAT = (Number of satisfied customers ÷ Total responses) × 100
Let’s say after closing a support ticket, a SaaS company sends a short customer survey asking users to rate their satisfaction with the resolution.
If 80 out of 100 respondents select 4 or 5, the CSAT score would be 80%. If that score drops below 65% over a specific time period, it may signal a need to retrain reps or streamline response times.
Note: It’s important to track trends over time. Look for drops that align with onboarding, pricing and service delivery changes to help you understand what events affect customer satisfaction.
Customer Effort Score (CES): understanding ease of interaction
Customer Effort Score (CES) measures how easy or difficult it is for a customer to complete a specific task, such as resolving a support issue or navigating your website.
CES is a strong predictor of customer loyalty, as low effort often leads to higher customer retention and reduced churn rate.
Customers typically respond to a question like the example below.
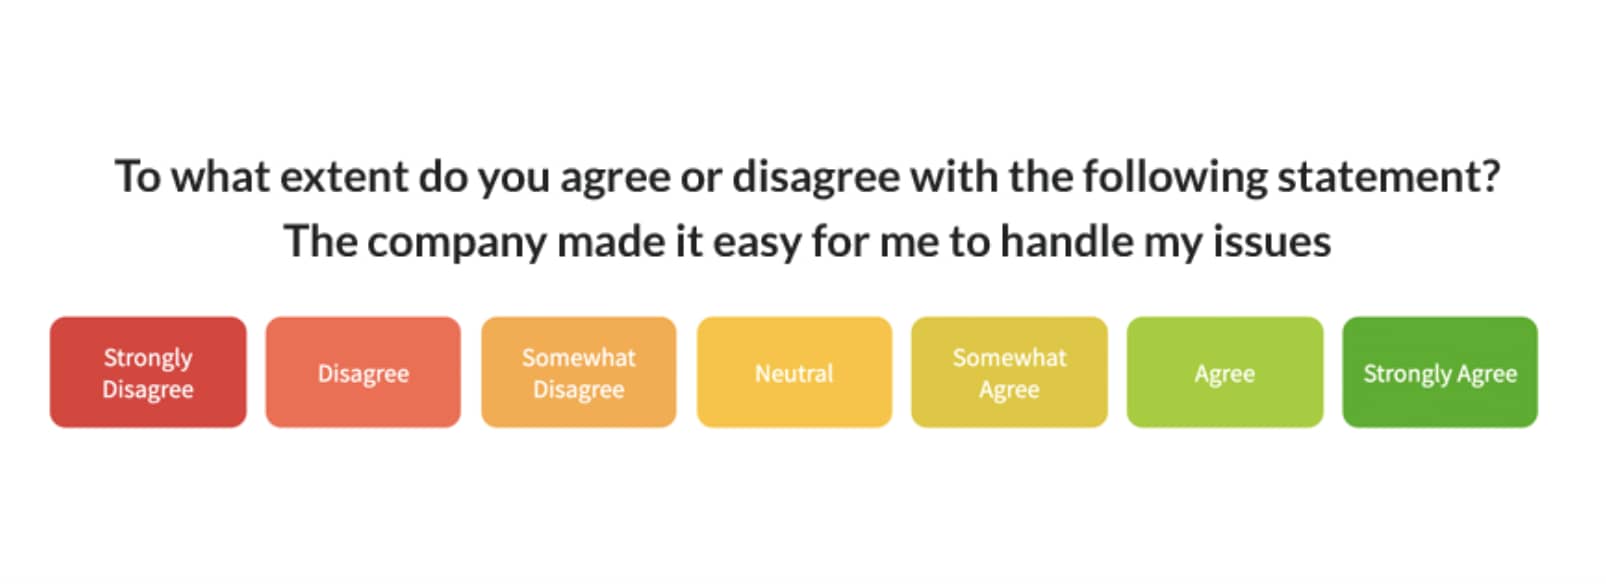
Customers rate their experience on a scale from 1 (very difficult) to 7 (very easy), though some companies use a 5-point or 10-point scale.
The score is usually reported as an average:
CES = Total score from all respondents ÷ Total number of responses
Low scores suggest friction in the process that could impact satisfaction and customer behavior.
For example, an e-commerce brand may send a CES survey after a customer completes a return. If customers consistently rate the process 3 or 4 out of 7, the business may need to simplify the returns page or reduce the required steps.
CES is most useful when analyzed alongside CSAT, NPS and qualitative customer feedback, helping you identify and remove barriers in the customer journey that affect conversion rate and user experience.
Content interaction metrics: measure pageviews, time-on-page and scroll depth
Content interaction metrics show how effectively your content keeps users engaged. These user engagement metrics help you understand whether people find value, stick around or drop off too quickly.
Common metrics include:
Pageviews. The total number of times a piece of content is loaded.
Average session duration. How long a user stays on your site or page during a visit.
Scroll depth. How far a user scrolls down the page (measured in percentages or pixels).
Bounce rate. The percentage of users who leave without taking action.
These metrics are typically tracked using tools like Google Analytics or in-app analytics platforms. They help marketing teams evaluate whether content aligns with user intent, supports marketing campaigns and improves the overall user experience.
For example, suppose a landing page for a SaaS product has a high pageview count but low scroll depth and average session duration. The disparity likely means the company’s target audience isn’t finding what they need, with user behavior indicating a mismatch in intent.
These numbers give more context than just the number of users, helping you understand user behavior and whether people consume your content as intended.
Channel performance metrics: track email open rates, CTR and social engagement
Channel performance metrics measure how effectively your marketing strategies attract new customers, nurture existing customers and drive conversion rate improvements.
These metrics focus on how audiences engage across key channels like email, social media and paid campaigns – providing insights into reach and relevance.
Key metrics to track include:
Email open rate. The percentage of recipients who open your email.
Click-through rate (CTR). The percentage of recipients who click a link in your message.
Social media engagement. Includes likes, shares, comments and clicks. High engagement suggests your content is resonating and building customer relationships.
With Campaigns, Pipedrive’s email marketing software, you can create, send and track email campaigns directly within your CRM. No third-party integrations needed.
For example, you can run a campaign report to see a top-level view of performance over time.
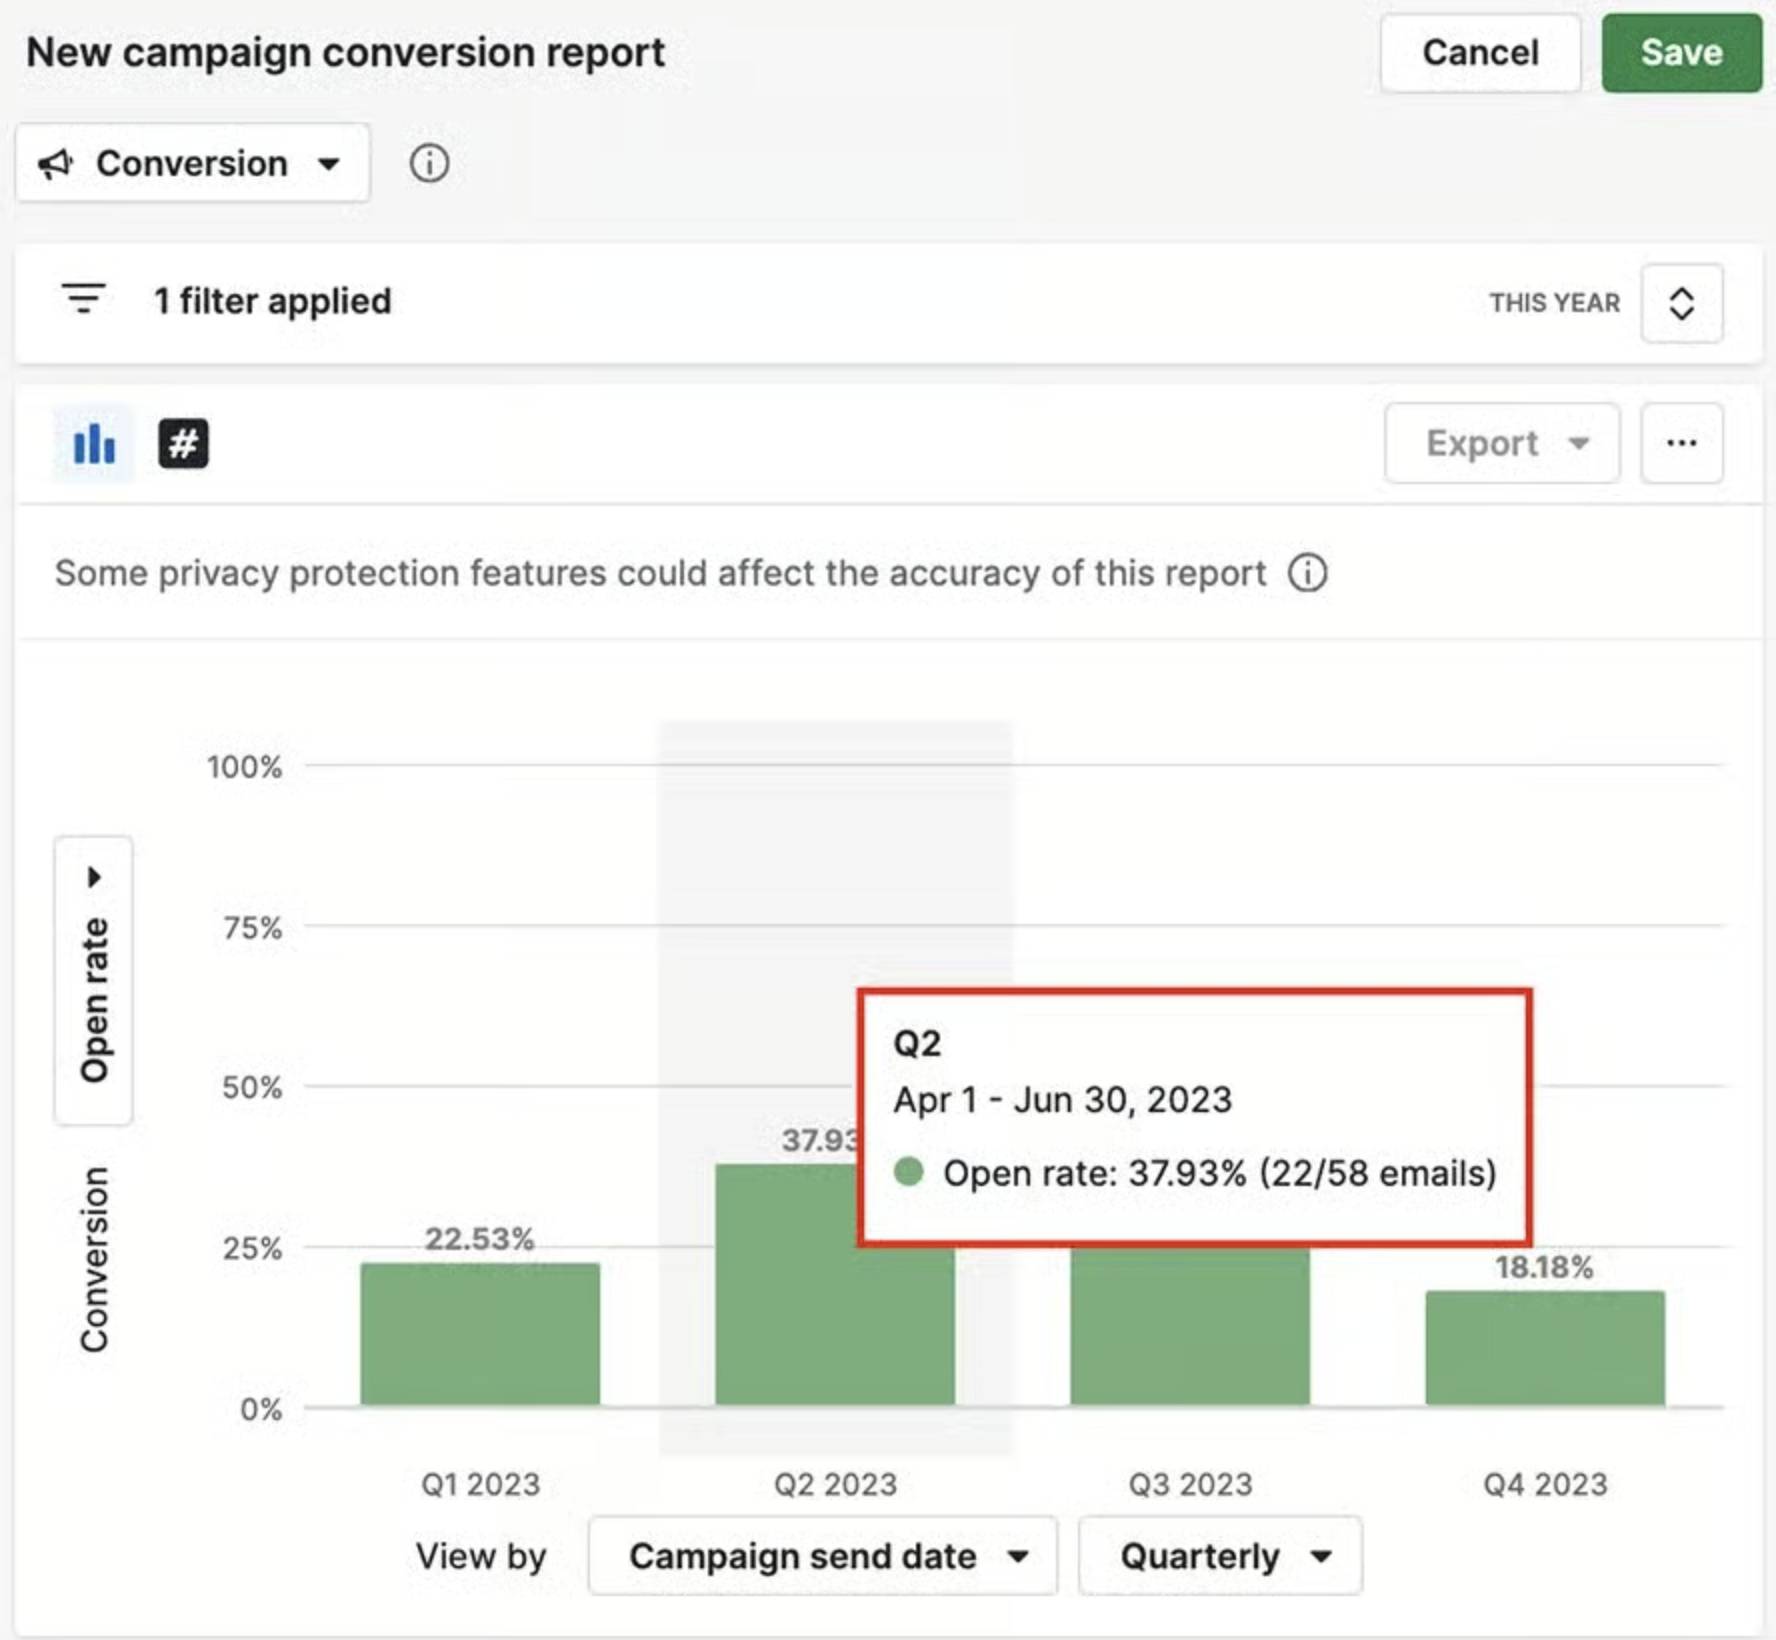
You can also get more granular by running reports on engagement to see unique/total opens, unique/total clicks and click-through rate.

This level of detail makes it easy to see which messages resonate with new and existing customers, helping you decide how to increase customer engagement through personalized campaigns.
Important sales engagement metrics worth monitoring
Tracking customer engagement metrics is just one part of the equation. Just as important is tracking relevant sales engagement metrics.
Sales engagement metrics show where deals gain momentum and where they stall. Sales metrics also show which actions impact conversion rate, customer retention rate and long-term customer engagement management goals.
Luckily, Pipedrive makes it easy to track these sales metrics in one place. From monitoring lead response times to scoring engagement levels, you can see which activities drive results and adjust your approach in real time.
Lead response time
Lead response time is the average time your sales team takes to follow up with a new lead. The faster your team responds, the higher your chances of conversion. Research consistently shows that delays can sharply reduce the likelihood of making contact and qualifying leads.
One study from Lead Response Management found that companies responding within five minutes were 21 times more likely to convert leads than those waiting 30 minutes or longer.
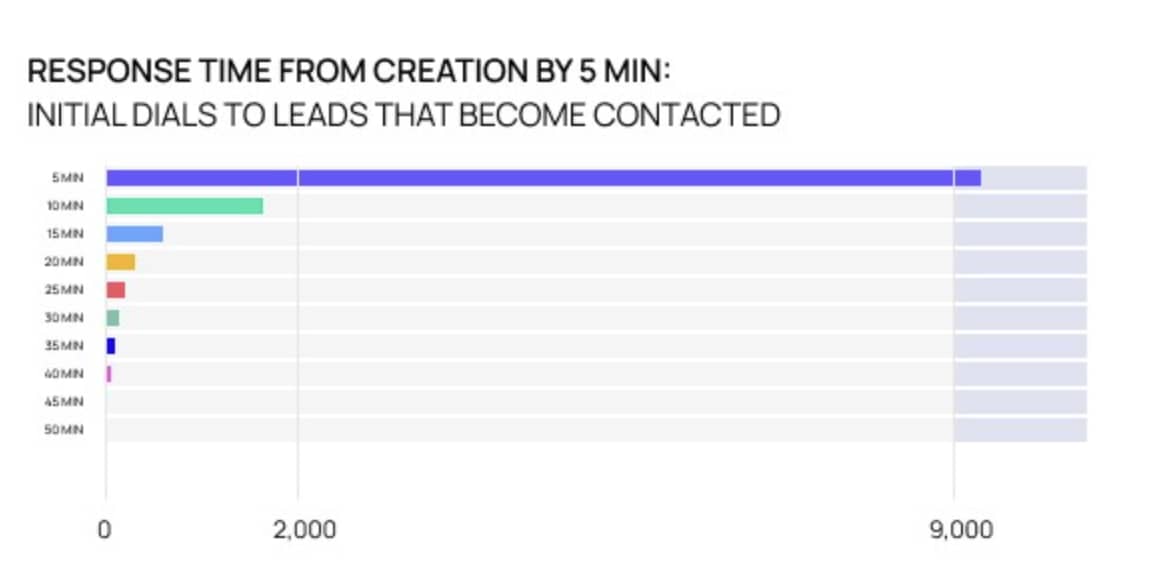
If two reps receive similar leads but one responds in 10 minutes and the other takes two days, the faster responder is far more likely to convert.
Especially in SaaS and e-commerce, where buyers expect immediate attention, being first to respond can be the difference between winning or losing a deal and increasing your number of customers over time.
With Pipedrive’s Leads Inbox feature, incoming leads are automatically captured, organized and visible in one place.
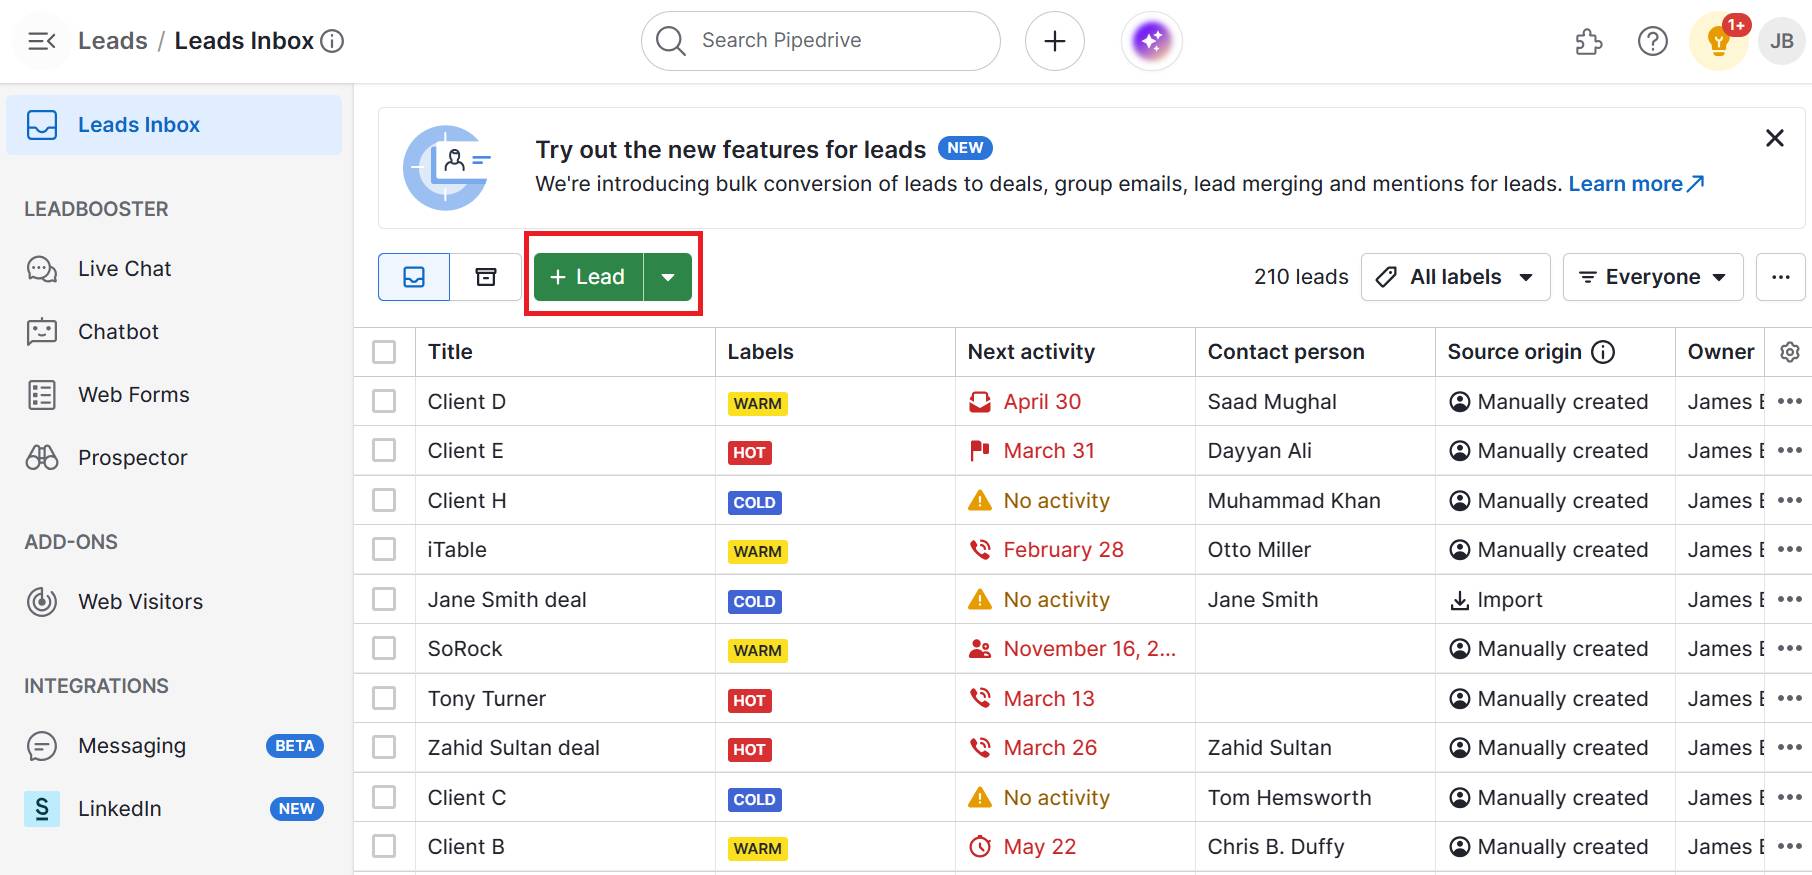
Keeping leads in one place enables your team to act on them quickly, keeping you within that crucial response window and maximizing your chance to convert.
Pipedrive in action: The Pitch (a UK-based design competition run by Inkwell) used Pipedrive’s Leads Inbox to cut response times dramatically and stay on top of thousands of entrepreneur applications. By centralizing leads, the team reduced admin work, improved follow-up consistency and ensured no opportunity slipped through the cracks.
Deal-to-close conversion rate
Deal-to-close conversion rate measures the percentage of deals in your pipeline that result in a successful close over a given period. It’s one of the most direct indicators of how effectively your team turns engaged prospects into paying customers.
A healthy conversion rate often means your engagement efforts (like timely follow-ups, personalized outreach and relevant content) resonate with prospects and guide them through the customer journey.
A low rate may suggest issues in sales messaging, qualification and later-stage engagement.
With Pipedrive’s pipeline management feature, you can see how many deals move from creation to closed-won, broken down by sales stage, rep or time period.
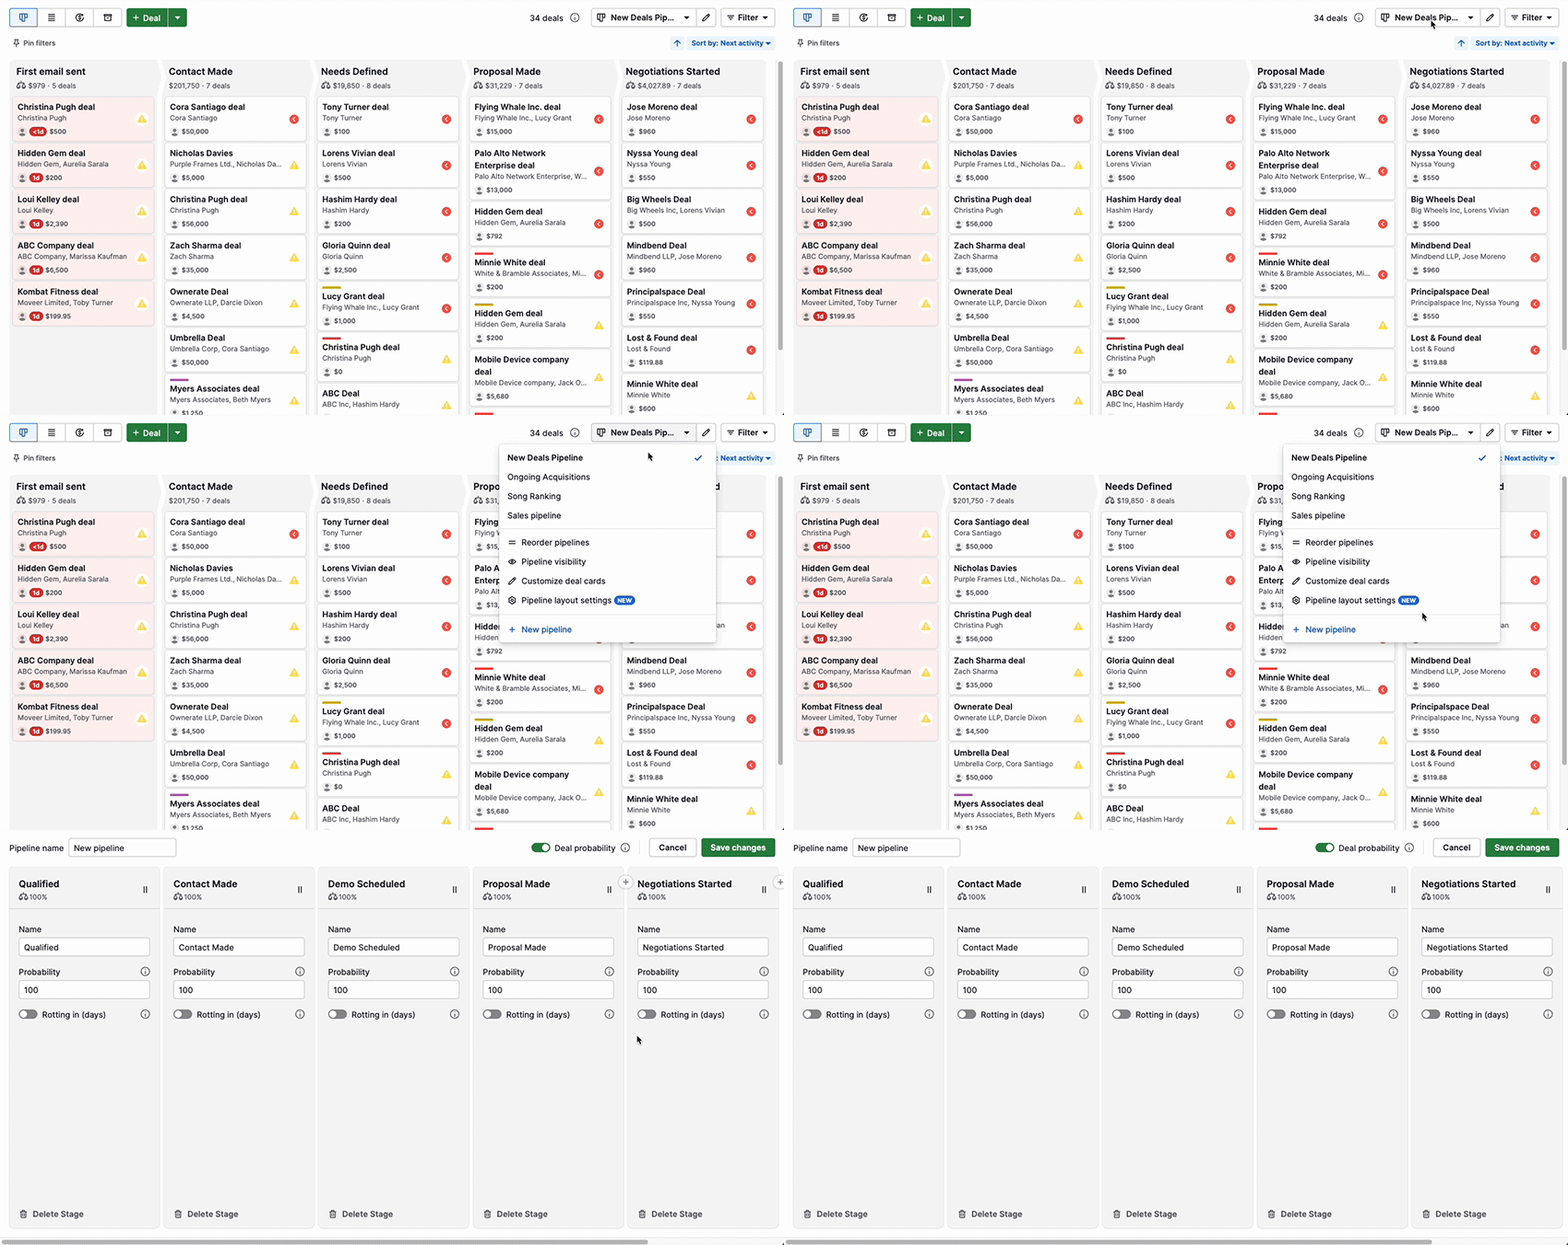
Filtering by deal source also reveals which customer engagement marketing channels deliver the most engaged and highest-converting leads. Knowing this data will help you focus on areas that will reduce customer churn.
For example, if you created 80 deals last quarter and closed 20, your conversion rate is 25%.
Pipedrive in action: Wilderness International, a nonprofit dedicated to rainforest conservation, used Pipedrive’s pipeline management to improve visibility into its donor relationships and track every stage of the funding process. As Johann‑Georg Cyffka, Cooperation Lead, said:
“Thanks to Pipedrive, we no longer waste time trying to bring order to the chaos, but can seamlessly pick up where we left off with negotiations or the evolution of a partnership. This allows us to manage twice as many partnerships as before we started using Pipedrive. With the program, one team member can do the work of two – in the same amount of time!”
Using Pipedrive’s stage-by-stage reports, you might see that most drop-offs occur during the proposal stage, signaling a need to refine pricing discussions or follow-up timing.
Follow-up completion rate
Follow-up completion rate measures the percentage of scheduled outreach activities (e.g., calls, emails, meetings) that your sales team actually completes.
A strong follow-up rate helps maintain customer relationships, reinforce trust and move opportunities through the pipeline.
Missed follow-ups can lead to lower conversion rates, higher churn risk for existing customers and wasted marketing investment on leads that never get nurtured.
Pipedrive’s Activities feature lets you schedule, assign and track all sales communications in one place.
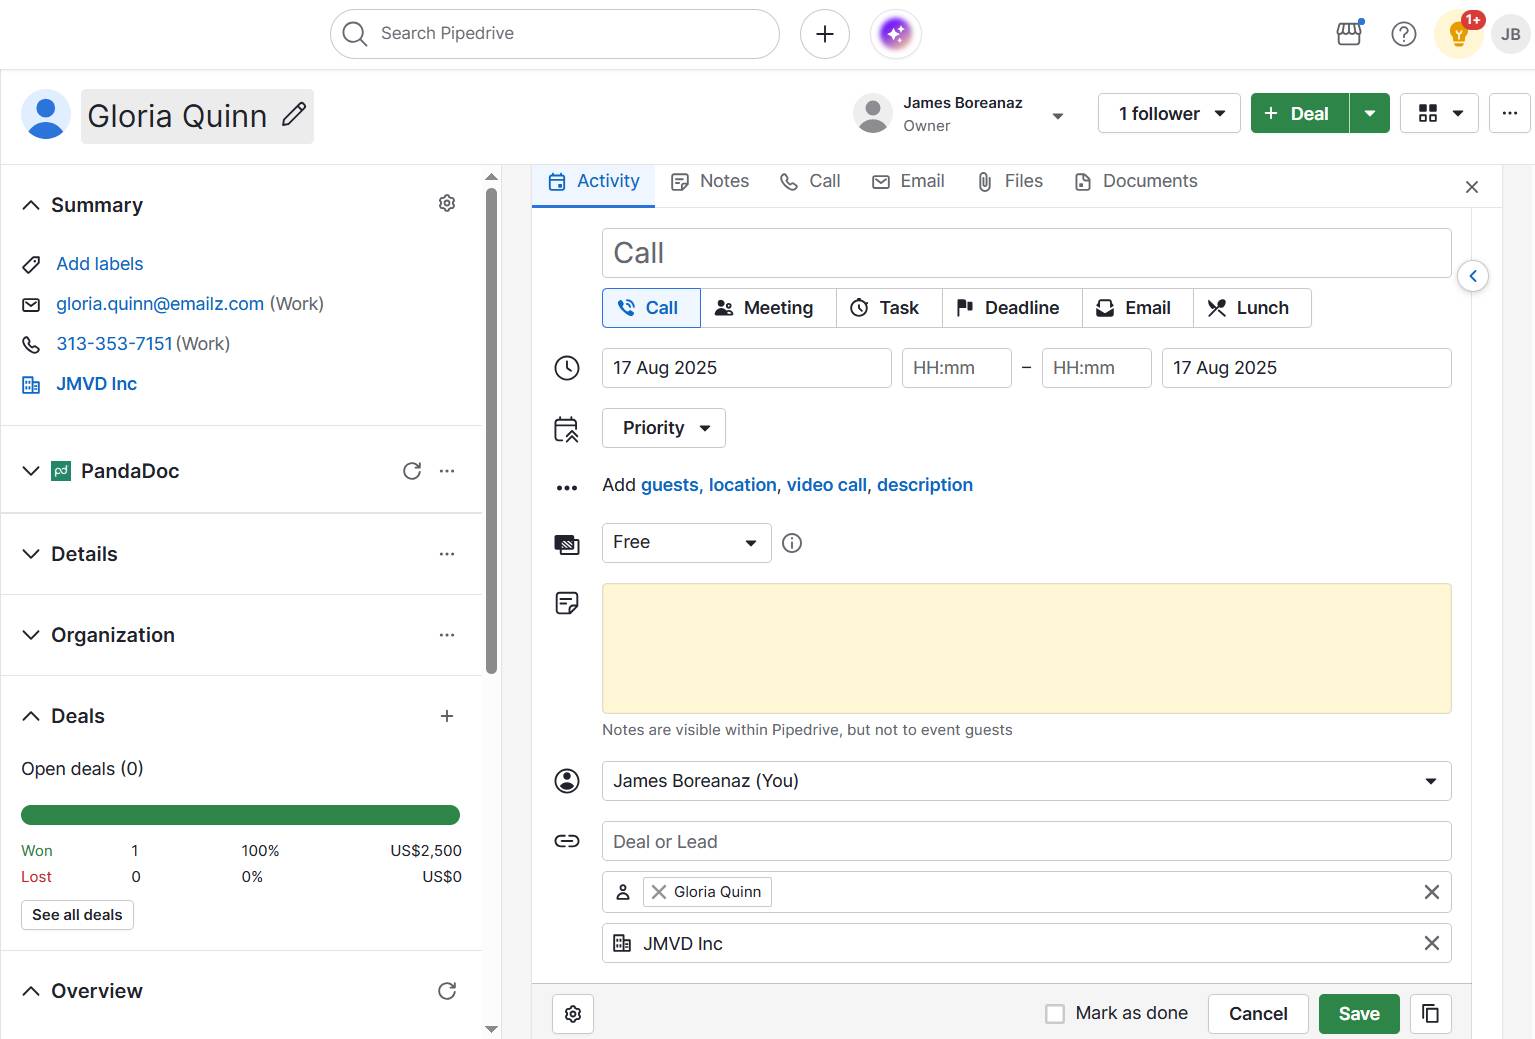
With built-in reminders, reps know exactly when to make that next call or send a follow-up email.
The Goals feature adds another layer by allowing managers to set completion targets and see real-time progress, ensuring follow-ups aren’t just planned, but completed.
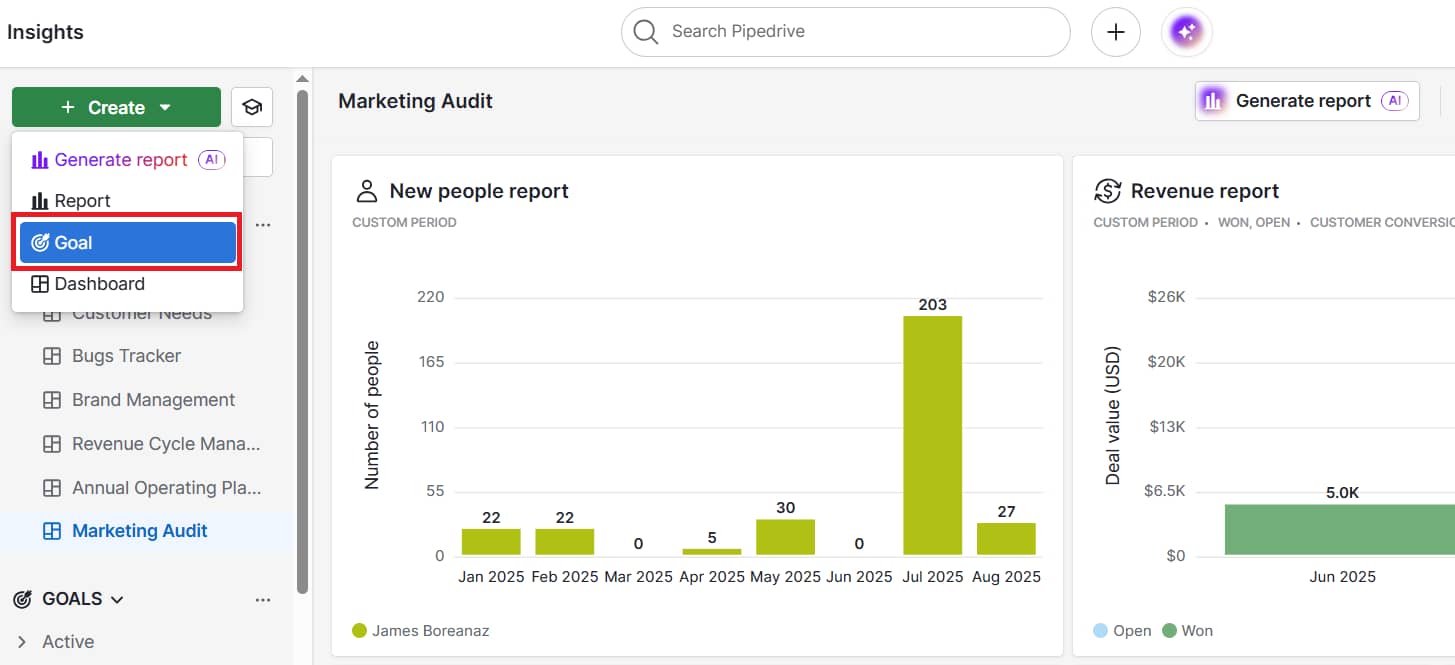
By consistently tracking these sales engagement metrics, you can see how well interest turns into action and where to fine-tune your approach.
How to measure and analyze customer engagement
Measuring customer engagement metrics is only valuable if you turn the data into action.
The goal is to link your KPIs to specific improvements across marketing, sales and customer success so every team works toward the same outcomes: better retention, higher satisfaction and stronger customer relationships.
Below is a streamlined process you can follow:
Step | What to do |
|
1. Define clear objectives | Decide what to improve (e.g., retention, churn rate, referrals) and pick metrics that track it (NPS, CSAT, adoption rate). |
|
2. Collect data from all touchpoints | Pull insights from web analytics, email CTR, in-app behavior and support logs into one CRM view. |
|
3. Segment customers | Group by engagement level: promoters, passives or detractors. Tailor strategies for each. |
|
4. Analyze trends vs. benchmarks | Compare current and historical metrics to spot drops in engagement, spikes in bounce rate and declines in repeat purchases. |
|
5. Act on insights in real time | Make targeted changes, then monitor KPIs over time to see if they work. |
Following this process keeps engagement tracking actionable, ensuring every metric you collect feeds into a customer engagement strategy that improves customer experience and drives long-term growth.
Best customer engagement software
Using the right tools ensures you can track, analyze and act on customer engagement data without guesswork. The most effective solutions combine marketing, sales and support insights so teams can see the full customer journey in one place.
CRM platforms: a central hub for customer data
A customer relationship management (CRM) platform is the foundation for tracking customer engagement metrics across interactions.
It stores every interaction in one record, from the first marketing email to post-sale support. This unified view makes measuring metrics like engagement rate, churn rate and customer lifetime value (CLV) easier.
Pipedrive, for example, offers built-in CRM features that let you monitor customer behavior in real time.
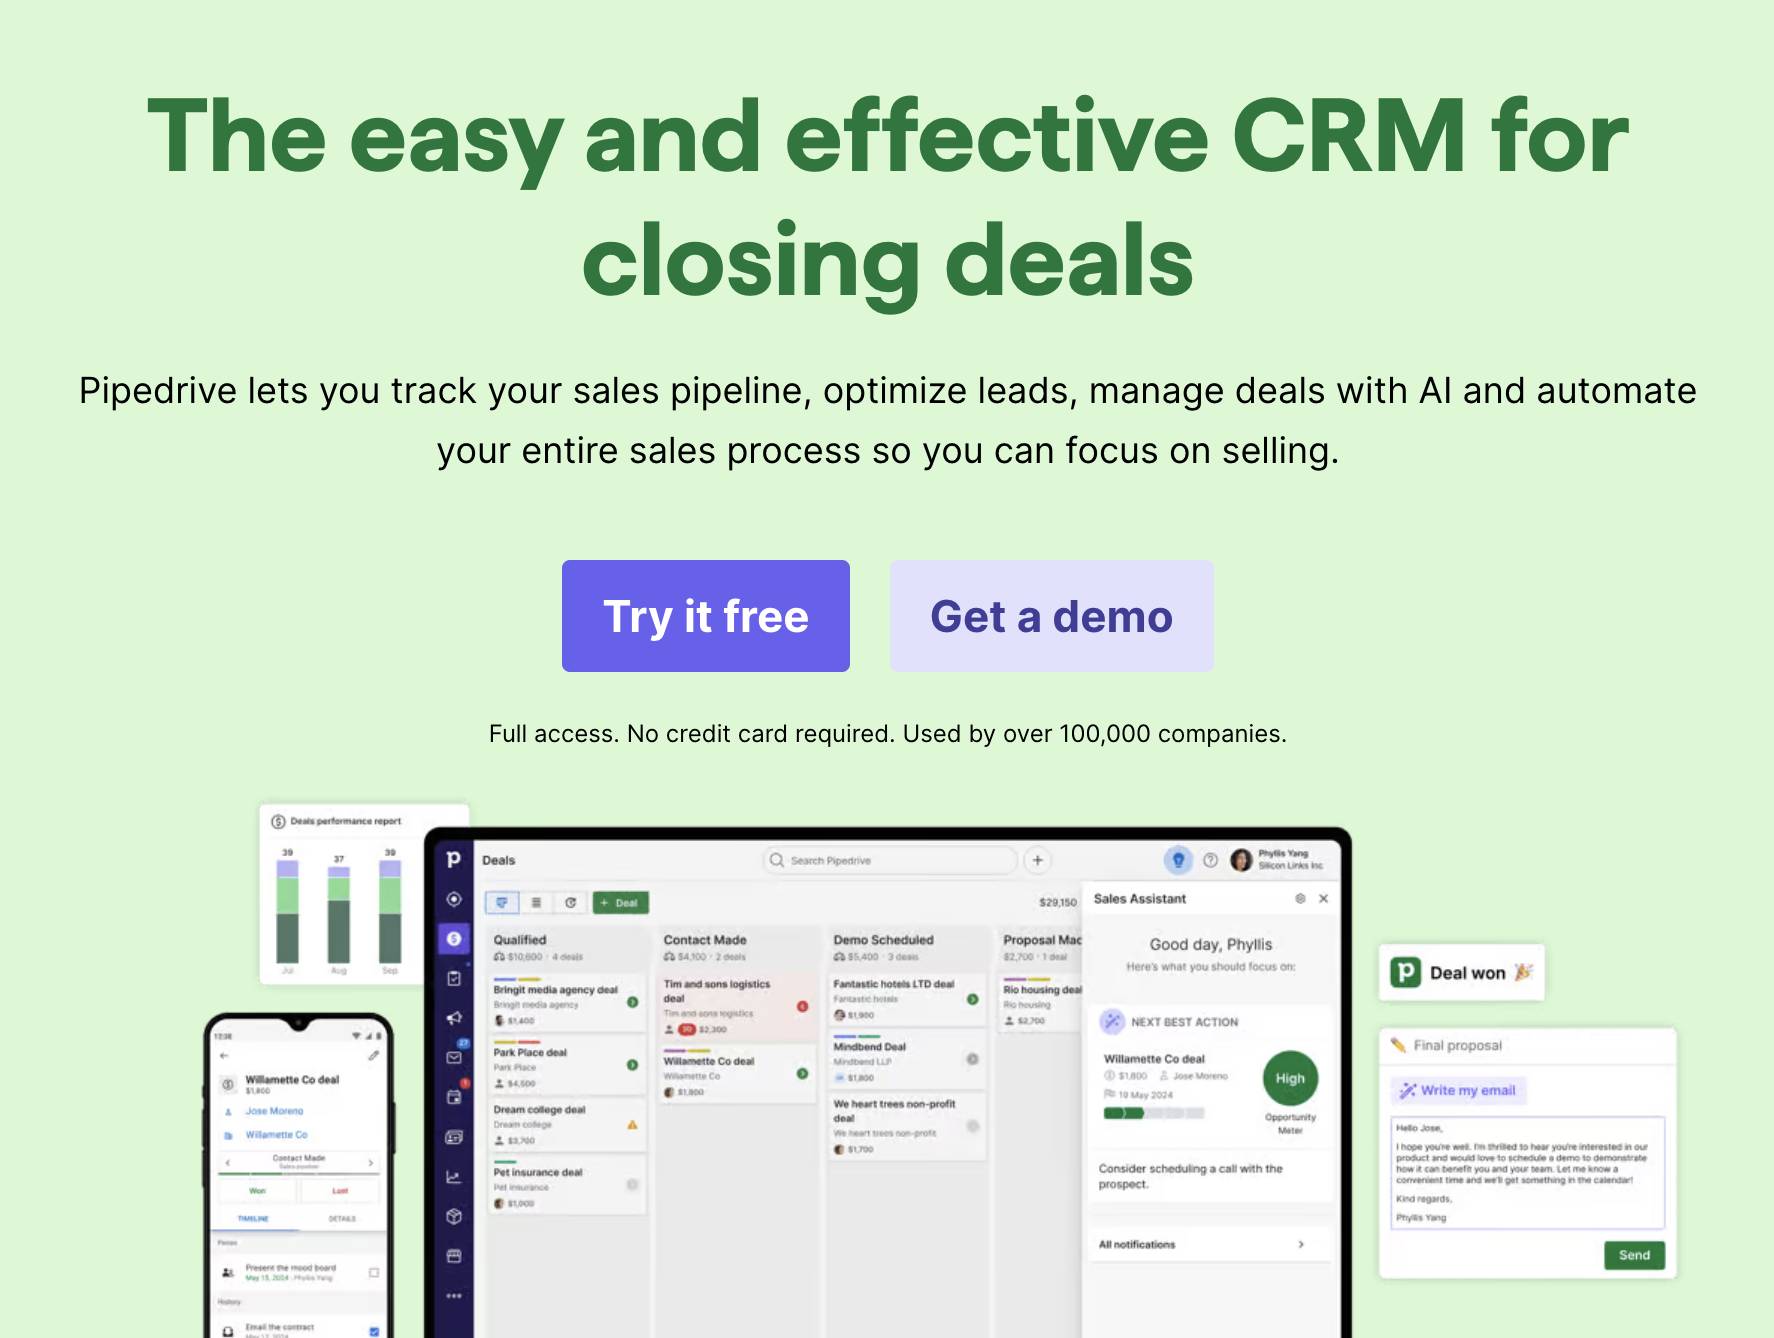
You can organize leads, track calls and emails, schedule follow-ups and monitor deal progress in real time.
This approach removes silos and ensures your KPIs reflect the entire customer journey.
Analytics tools: measuring website and app interactions
Analytics tools measure user engagement metrics on your website or in-app environment. They track activity like page views, average session duration, scroll depth and click-through rate (CTR).
These insights help you understand which content or features keep customers engaged and which cause high bounce rates.
Google Analytics remains a leading choice, especially when paired with sales analytics to connect marketing activity with conversions.
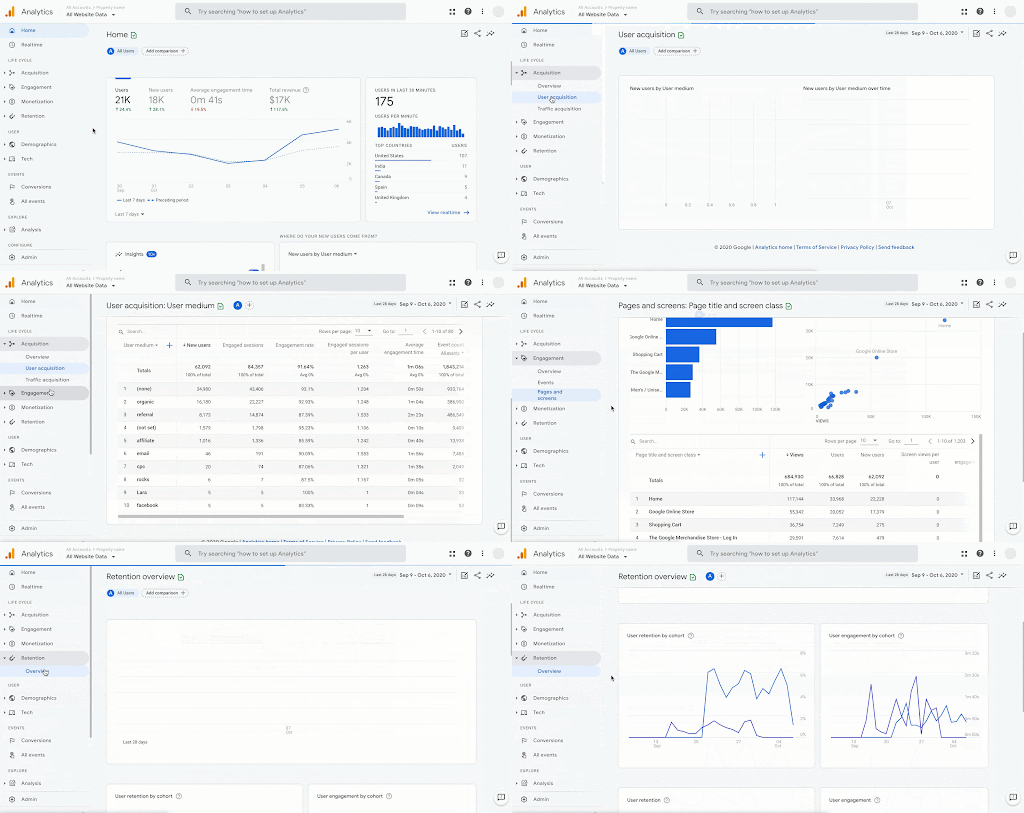
For SaaS companies, tools like Mixpanel provide event-level tracking to see adoption rate over a specific period, helping you optimize product stickiness and reduce churn.
Survey and feedback tools: capturing sentiment directly
While behavioral data shows what customers do, survey tools reveal why they do it.
Platforms like Jotform and SurveySparrow, which both integrate with Pipedrive, allow you to measure NPS, CSAT and customer effort score (CES) with minimal friction.
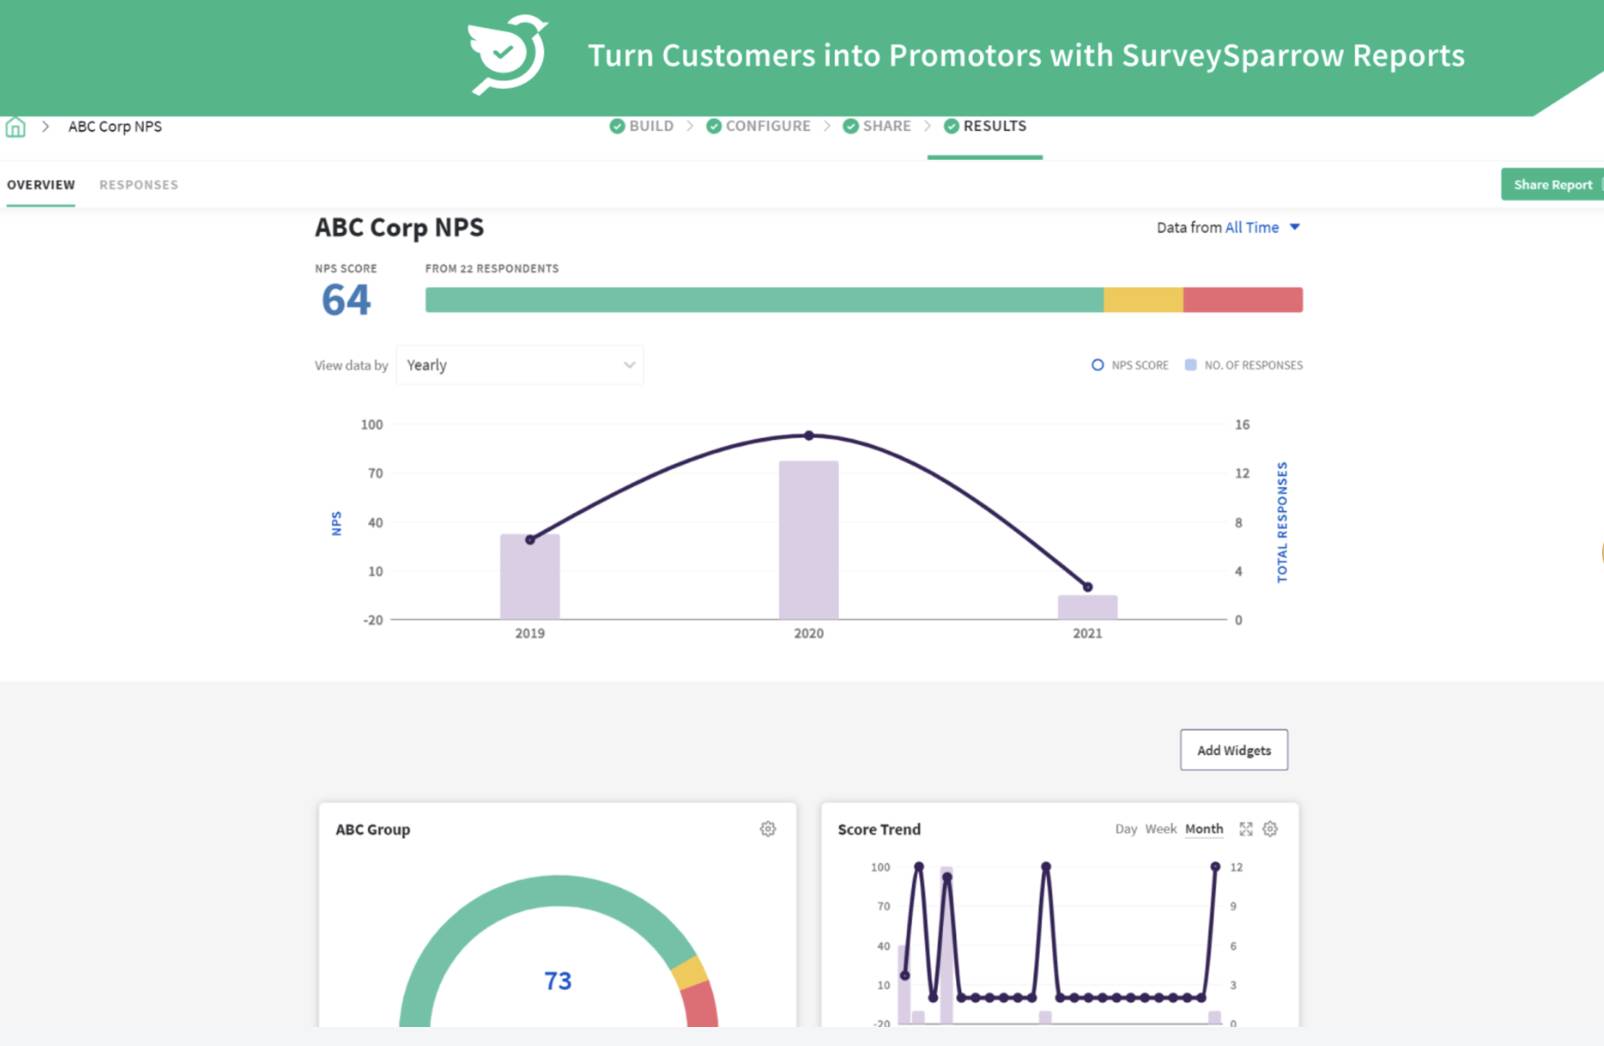
Consistently gathering customer feedback uncovers hidden issues in user experience and validates your engagement strategies.
Linking survey results to your CRM ensures responses are tied to each customer record. You can compare sentiment metrics against performance indicators like repeat purchases or upsell rates.
Final thoughts
Tracking customer engagement metrics is about understanding what drives loyalty, satisfaction and long-term growth.
By measuring the right KPIs, you can spot trends early, act on insights in real time and create experiences that keep customers coming back.
Try Pipedrive for free with a 14-day trial and see how simple it can be to turn engagement data into business growth.


