For sales-focused teams in growing SMBs, CRM metrics can mean the difference between chasing numbers and hitting targets. CRM metrics give you the clarity to focus on what drives business growth.
In this guide, you’ll learn which CRM metrics matter most for small and mid-sized businesses, why they’re essential and how to track them using a CRM system.
Use these insights to streamline your sales process, improve retention and close deals faster.
Key takeaways from CRM metrics
CRM metrics are measurable data points that show how well your sales, marketing and customer success efforts are performing.
They help small and mid-sized businesses turn daily activity into actionable insights that drive revenue, retention and smarter decision-making.
Sales-focused teams should prioritize customer lifetime value (CLV), lead conversion rate and pipeline velocity to improve forecasting, close more deals and increase efficiency.
Pipedrive makes it easy to track, visualize and act on your CRM metrics with real-time dashboards and automated reports – try it free for 14 days.
What are CRM metrics?
CRM metrics are indicators that show how well your customer relationship management efforts are performing.
Metrics include measurements such as lead conversion rate, customer lifetime value (CLV) or churn rate.
They’re a type of key performance indicator (KPI) – values companies track to see whether they’re achieving their strategic goals.
For example, tracking lead response time shows how quickly your sales team follows up with potential customers. It may indicate how accurate the customer information stored in your CRM is.
Other CRM metrics might include revenue forecasts, deal conversions or win rates or new deals in the pipeline. Here’s how this looks in a Pipedrive dashboard:
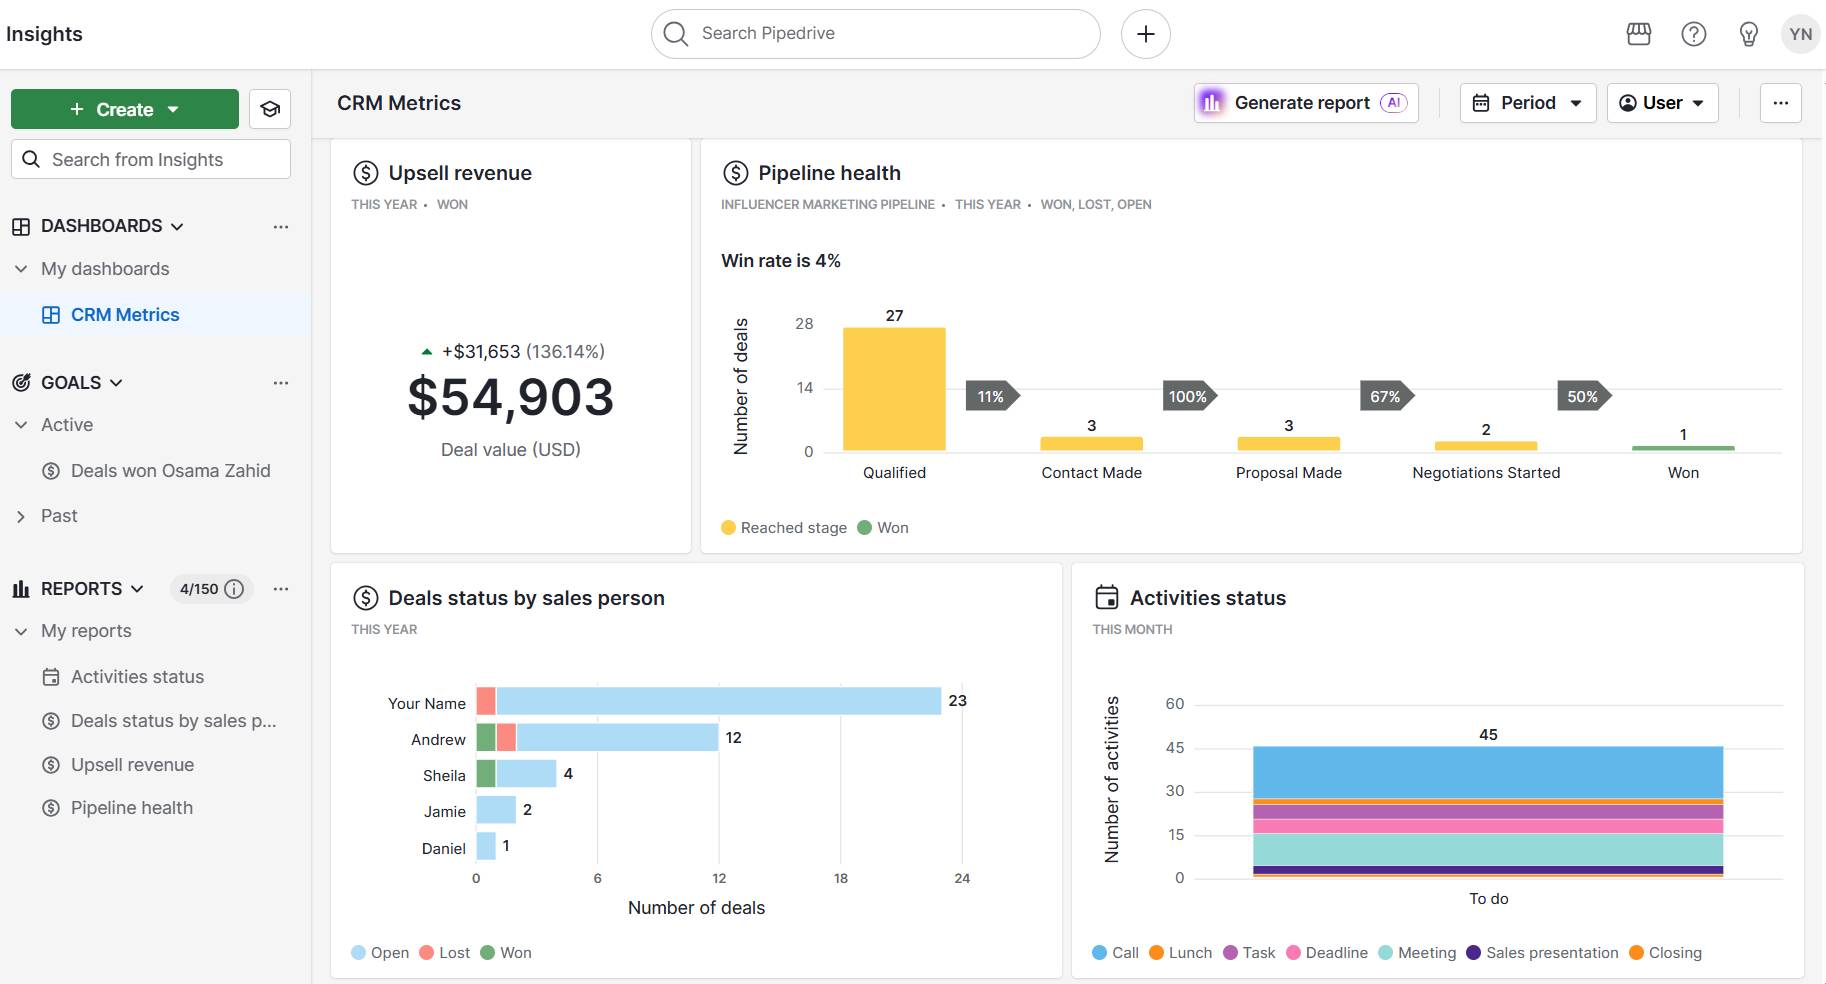
Clean CRM data and consistent tracking are critical, especially for small businesses. When resources are limited, accurate CRM adoption metrics can guide smarter decisions, highlight what to prioritize and show where to improve.
Why CRM metrics matter for SMBs
Small and mid-sized businesses can grow faster using CRM data to make informed choices.
A 2023 study on how CRM systems impact SME performance found that CRM adoption led to a 25–40% increase in customer retention and a 15–30% rise in sales among SMEs.
For companies with limited time, budget and people, tracking the right CRM metrics turns day-to-day activity into measurable business growth.
Here’s why it’s important to track metrics in your CRM:
Better decision-making. CRM metrics give leaders real-time visibility into sales performance, customer engagement and marketing campaigns. That’s why 87% of respondents use CRM software to track sales, according to Pipedrive’s State of Sales and Marketing report.
Early detection of bottlenecks. When you track the sales cycle or lead response time, you can quickly spot where deals get stuck or opportunities are lost, helping your team respond before it affects revenue.
Smarter resource optimization. CRM metrics show which workflows and channels deliver results. Knowing where to focus your time and budget increases your return on investment.
Alignment between marketing and sales. Research shows 74% of CRM users say their system gives better access to customer data, helping both teams stay aligned and informed. Sharing key performance indicators like conversion rate helps both teams work toward shared business goals.
Stronger customer retention. Metrics like churn rate, NPS and renewal rate highlight how well you’re meeting customer needs. These indicators show you how to improve the customer experience and extend the customer lifespan.
Essential metrics for every SMB to track
There are lots of CRM metrics to choose from. fFor small and mid-sized businesses, focusing on a few high-impact metrics creates clarity and control.
Let’s start with some of the most important ones to track.
Customer lifetime value (CLV)
Customer Lifetime Value (CLV) shows how much revenue a customer is expected to generate over the course of their relationship with your business. It’s a forward-looking metric that helps you focus on long-term profitability, not just short-term wins.
Formula: CLV = Average purchase value × Purchase frequency × Customer lifespan
Why it matters: When you understand CLV, you can make better decisions about:
How much to spend on customer acquisition
Where to invest in retention
Which sales strategies deliver the most value over time
Tracking CLV in your CRM system helps you segment customers, forecast total revenue more accurately and identify your most valuable relationships.
Did you know? Harvard Business School’s landmark study showed that acquiring a new customer can cost 5-25 times more than keeping existing ones. High CLV customers are also more likely to refer others and engage with upsell opportunities.
Customer acquisition cost (CAC)
Customer Acquisition Cost (CAC) measures how much you spend to acquire a new customer. It includes spending on marketing efforts, sales team activity and tools like CRM software or social media ads.
Formula: CAC = Total acquisition spend ÷ Number of new customers
Why it matters: CAC shows how efficiently you turn potential customers into actual buyers. If it’s high compared to Customer Lifetime Value (CLV), you’re likely overspending to close deals.
Compare CAC across different campaigns or channels to see which ones drive the most efficient growth. Over time, optimize your sales funnel to lower costs and boost return on investment.
Customer retention rate
Customer retention rate shows how many customers you keep over a specific period. A high retention rate often means you’re meeting customer needs and delivering a strong customer experience.
Formula: Retention Rate = ((Number of customers at end of period − New customers acquired) ÷ Customers at start of period) × 100
Why it matters: Retention rate is especially important for subscription-based businesses or those with long sales cycles. As mentioned above, keeping existing customers is more cost-effective than acquiring new ones.
Tip: Even a small increase in retention can significantly boost profitability. Use CRM workflows and automation for timely follow-ups and renewals.
Churn rate
Churn rate measures how many customers stop doing business with you during a specific time frame. It’s a key indicator of customer dissatisfaction or misalignment between your offer and customer expectations.
Formula: Churn Rate = (Customers lost during period ÷ Total customers at start of period) × 100
Why it matters: High churn, or customer attrition, usually signals issues with your product, service or customer support.
Some ways to boost retention include:
Improving onboarding to set clear expectations early
Using follow-ups and check-ins to strengthen relationships
Offering loyalty rewards or exclusive benefits for long-term customers
Acting quickly on customer feedback to resolve recurring pain points
Note: Your CRM system should help you monitor churn by tagging lost deals, tracking customer interactions and identifying at-risk accounts.
Net Promoter Score (NPS)
Net Promoter Score (NPS) measures how likely your customers are to recommend your business to others. It’s a simple yet powerful way to track loyalty and predict future growth.
Customers are asked one question: “How likely are you to recommend us on a scale of 0 to 10?”
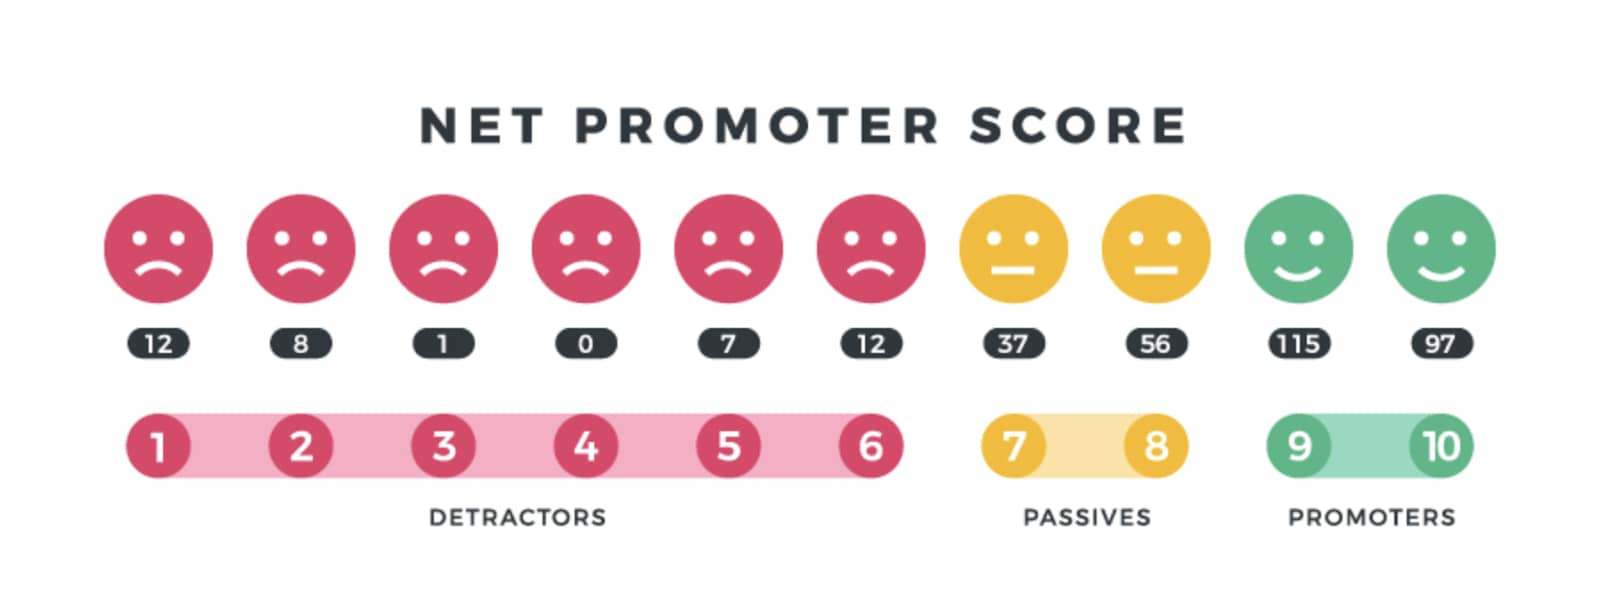
Responses are grouped into Promoters (9–10), Passives (7–8) and Detractors (0–6).
Formula: NPS = % of Promoters − % of Detractors
Why it matters: Your Net Promoter Score (NPS) gives you a clear snapshot of customer loyalty. The higher your NPS, the more likely your customers are to refer others, renew contracts and stay engaged over time.
NPS surveys are best used after key customer interactions, like onboarding or support requests. Act on what you learn to improve customer engagement.
Lead generation and qualification metrics
Leads are the starting point of every sales pipeline, but their real value comes from knowing which ones will most likely become customers.
By tracking lead generation and lead qualification metrics, small and mid-sized businesses can see how many leads they attract and how well those leads fit their ideal customer profile.
Leads
The leads metric tracks the total number of leads captured during a specific period and gives you a clear picture of how many prospects are entering your funnel.
Leads can come from various sources:
Website forms and landing pages
Social media campaigns and ads
Email signups or newsletters
Referrals from existing customers
Events, trade shows or webinars
Outbound prospecting and cold outreach
Why it matters: Tracking this metric helps measure the effectiveness of your lead generation activities and spot trends across your marketing channels.
It’s important to track both the quantity and source of leads. If lead volume is high but your conversion rate is low, that’s a signal to review your targeting, messaging or qualification process.
Note: A lead is different from a marketing qualified lead (MQL). A lead is any potential customer who shows initial interest, while an MQL is a lead that meets specific criteria – such as demographics or behavior – indicating they’re more likely to become a paying customer.
Lead conversion rate
Lead conversion rate shows what percentage of your leads turn into qualified opportunities or paying customers.
It’s a key CRM metric that reveals how effectively your sales process turns interest into revenue.
Formula: Lead Conversion Rate = (Converted leads ÷ Total leads) × 100
Why it matters: Lead conversion rate shows how well your outreach and qualification efforts are working – and where leads drop off. It’s a key indicator of alignment between sales and marketing.
With Pipedrive, you can build a lead conversion report using Insights.
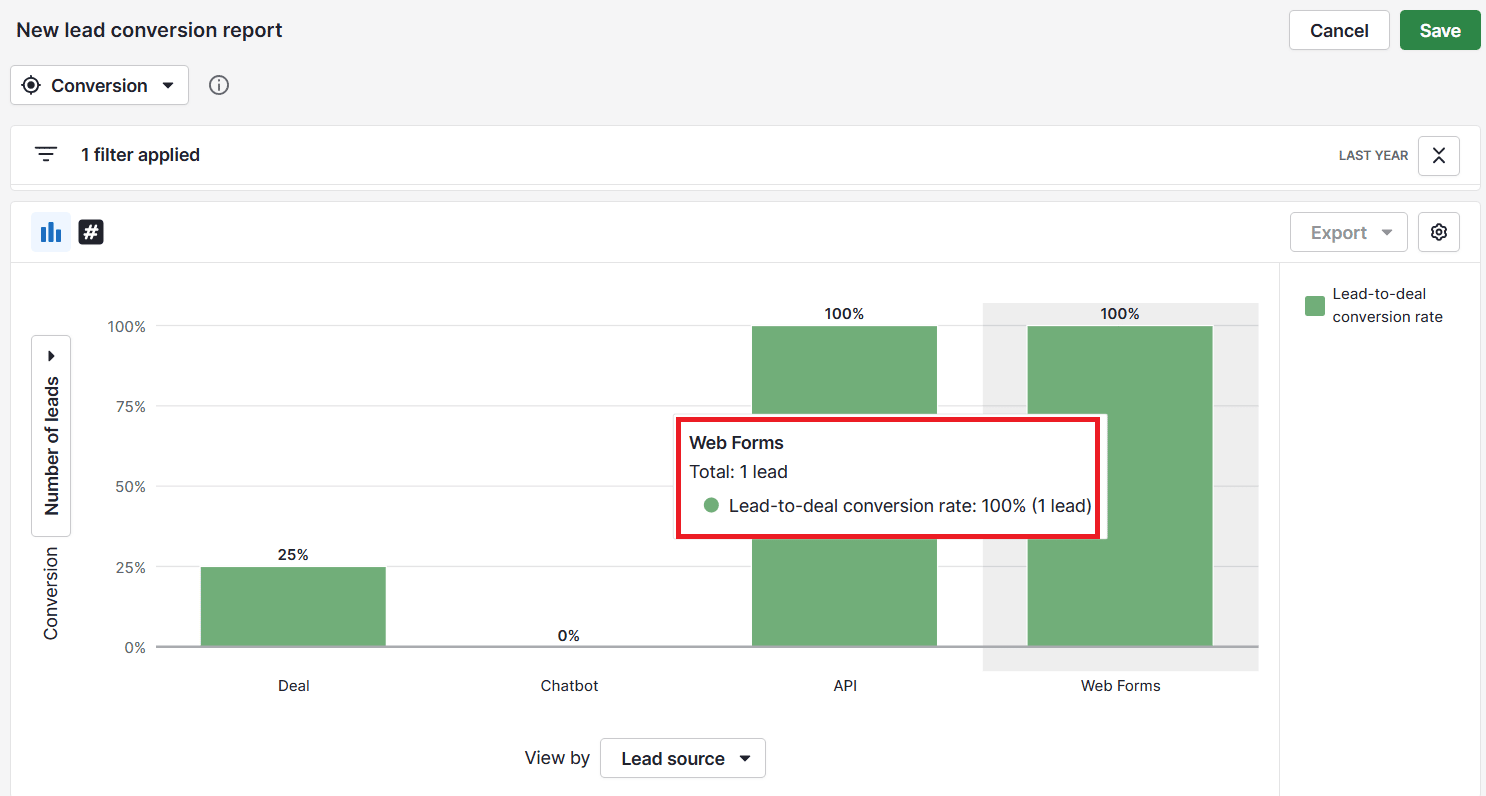
The report shows how many leads convert within a specific period, highlights which sources bring in the highest-quality leads and helps you optimize marketing campaigns for better results.
Lead response time
Lead response time measures how quickly your team follows up with a new lead after it enters your CRM system.
The faster the follow-up, the higher the chance of conversion.
Why it matters: Use this metric to monitor how well your sales team handles inbound interest. Fast response times signal a well-organized team and strong sales workflows. Slow follow-ups might point to process bottlenecks or resource gaps.
How to measure lead response time:
Record the exact time a new lead enters your CRM (e.g., through a form submission, email or call)
Record the time of the first sales interaction logged in the CRM (e.g., email sent, call made or meeting scheduled)
Subtract the lead creation time from the first interaction time to calculate the response time for each lead
Average the response times across all leads in a specific period to monitor performance
Tip: Set alerts and automation rules in your CRM to reduce response delays. Many platforms let you assign leads instantly or trigger email replies based on lead source or form activity.
Marketing ROI
Marketing return on investment (ROI) tells you how much revenue your marketing campaigns generate compared to your spending.
It’s one of the most important CRM performance metrics for evaluating performance across your marketing strategies.
Formula: Marketing ROI = (Revenue from marketing − Marketing spend) ÷ Marketing spend × 100
Why it matters: Marketing ROI reveals which channels drive revenue and where to adjust spend for maximum impact.
Track ROI by channel, like email, paid search or social media, to see where your budget has the most impact.
By measuring ROI in your CRM platform, you connect the full journey from campaign to closed deal. That gives you better insight into how marketing affects sales outcomes.
Customer engagement rate
Customer engagement rate measures how actively your leads or prospects interact with your content, messages or campaigns.
It reflects interest and intent before a sales conversation even begins.
Engagement can include actions like:
Email opens
Link clicks
Content downloads
Ad interactions
Why it matters: A high engagement rate means your messaging resonates. A low rate may signal the need to revise your targeting or offer.
This metric helps your sales team prioritize leads based on behavior across the customer journey, not just demographics.
Deal & pipeline management metrics
Once leads are qualified, your focus shifts to managing deals through the sales pipeline.
These CRM metrics help you understand how efficiently your team moves opportunities forward, identifies bottlenecks and closes deals.
Sales pipeline value
Sales pipeline value is the expected value of all open deals in your CRM system.
It tells you how much revenue you could bring in if every deal in progress were to close successfully.
Why it matters: Sales pipeline value helps you:
Plan resource allocation
Monitor the health of your sales process
It also shows whether your team has enough pipeline to meet business goals.
For example, if you have 20 open deals worth $10,000 each, your total pipeline value is $200,000. If your average close rate is 25%, you can reasonably forecast $50,000 in expected revenue.
You can segment your pipeline by stage, product or sales rep to see where the highest-value deals are concentrated and where progress may be stalling.
Segmenting helps you focus on the most promising opportunities and uncover critical bottlenecks.
Tip: Use weighted pipeline values to improve forecasting accuracy. Instead of treating every open deal as 100% likely to close, assign a probability to each stage in your pipeline.
For instance, deals in the negotiation stage might be given a 70% probability, while deals in the prospecting stage might be only 10%. Multiplying deal value by these probabilities gives a more realistic view of future revenue.
Pipeline velocity
Pipeline velocity measures how quickly deals move through your sales pipeline to become closed revenue.
It gives you a snapshot of sales efficiency over a specific period.
Formula: Pipeline Velocity = (Number of deals × Average deal value × Win rate) ÷ Sales cycle length
Why it matters: Pipeline velocity is useful for forecasting and identifying whether your pipeline is growing fast enough to meet your revenue goals. A slowdown may indicate delays in the sales process or a lack of qualified leads.
Use this metric to compare performance across teams, product lines or time frames. Faster velocity typically means better follow-ups, clearer messaging and more effective sales workflows.
Sales cycle length
Sales cycle length tracks the average time to close a deal, from first contact to final signature.
This core sales metric reflects how smoothly your sales process runs.
Why it matters: Shorter sales cycles often mean faster decision-making, higher urgency or better-fit leads. Longer cycles can result from complex deals, too many handoffs or follow-up delays.
Common reasons for a long sales cycle:
Too many stages in the sales funnel
Lack of clear qualification criteria
Delays in lead response time
Missed follow-ups or manual workflows
Industry benchmarks show how sales cycle length varies by sector.
A recent study found that SaaS and technology companies average about 67 days, manufacturing companies average 124 days and professional services close deals in around 51 days.
Knowing your industry’s typical cycle helps put your own metrics into perspective and sets realistic expectations for forecasting.
Tip: Your CRM system should give visibility into the average sales cycle by rep, deal type or source, so you can adjust strategies where needed.
Close rate
Close rate measures the number of deals your team wins compared to the number pursued.
It’s a simple, direct way to assess how effective your sales team is at turning opportunities into revenue.
Formula: Close Rate = (Number of closed-won deals ÷ Total number of deals) × 100
Why it matters: A high close rate usually means strong qualification, good timing and a sales process aligned with customer needs. A low rate might indicate poor fit, weak follow-ups or misaligned messaging.
With Pipedrive, you can track the close rate automatically through a deal conversion report.
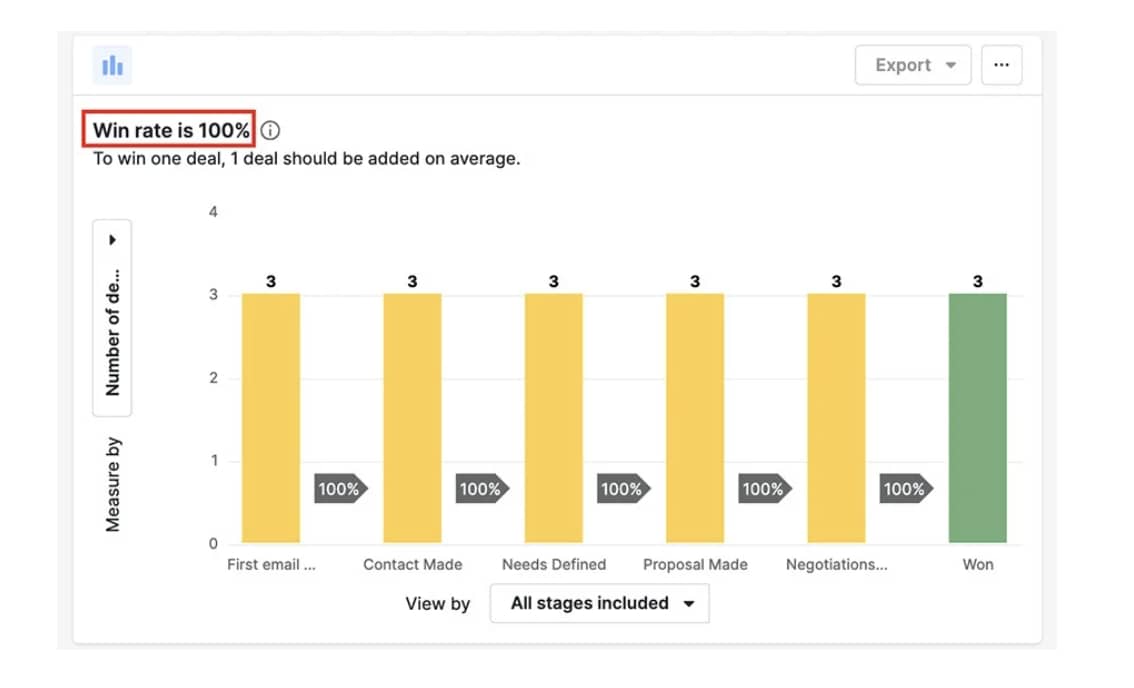
Conversion reporting is split into two types of reports:
Funnel conversion reports. Show how deals progress between stages in your sales pipeline, highlighting where drop-offs occur.
Win/loss conversion reports. Reveal overall win and loss rates across different groups, such as deal owner, organization or specific time periods.
Combining these insights allows you to forecast more accurately and build a sales strategy that consistently delivers results.
Net new revenue
Net new revenue tracks how much new income your business generates within a specific period, excluding renewals or upsells from existing customers.
It reflects your ability to bring in new business and expand your customer base.
Why it matters: This metric is especially useful for understanding the direct impact of your sales and marketing strategies on business growth. It helps leadership evaluate how well the sales team is acquiring new customers and whether lead generation efforts are paying off.
You can break net new revenue down to see where growth is strongest:
By product – Identify which offerings attract the most new customers
By region – Spot geographic areas where your sales strategies are most effective
By campaign – Measure the ROI of specific marketing initiatives
To measure net new revenue accurately, ensure your CRM data is clean and clearly distinguishes between new and existing customers.
Find more of the best leads fast with your lead qualification ebook
Customer success and retention metrics
Winning a deal is just the beginning. Long-term business growth comes from keeping customers happy, engaged and loyal.
These CRM metrics help you measure customer satisfaction, identify risks and strengthen retention strategies.
Customer satisfaction score (CSAT)
Customer Satisfaction Score (CSAT) tells you how satisfied customers feel after a specific interaction.
It’s typically measured by asking customers to rate their experience on a scale from 1 to 5.
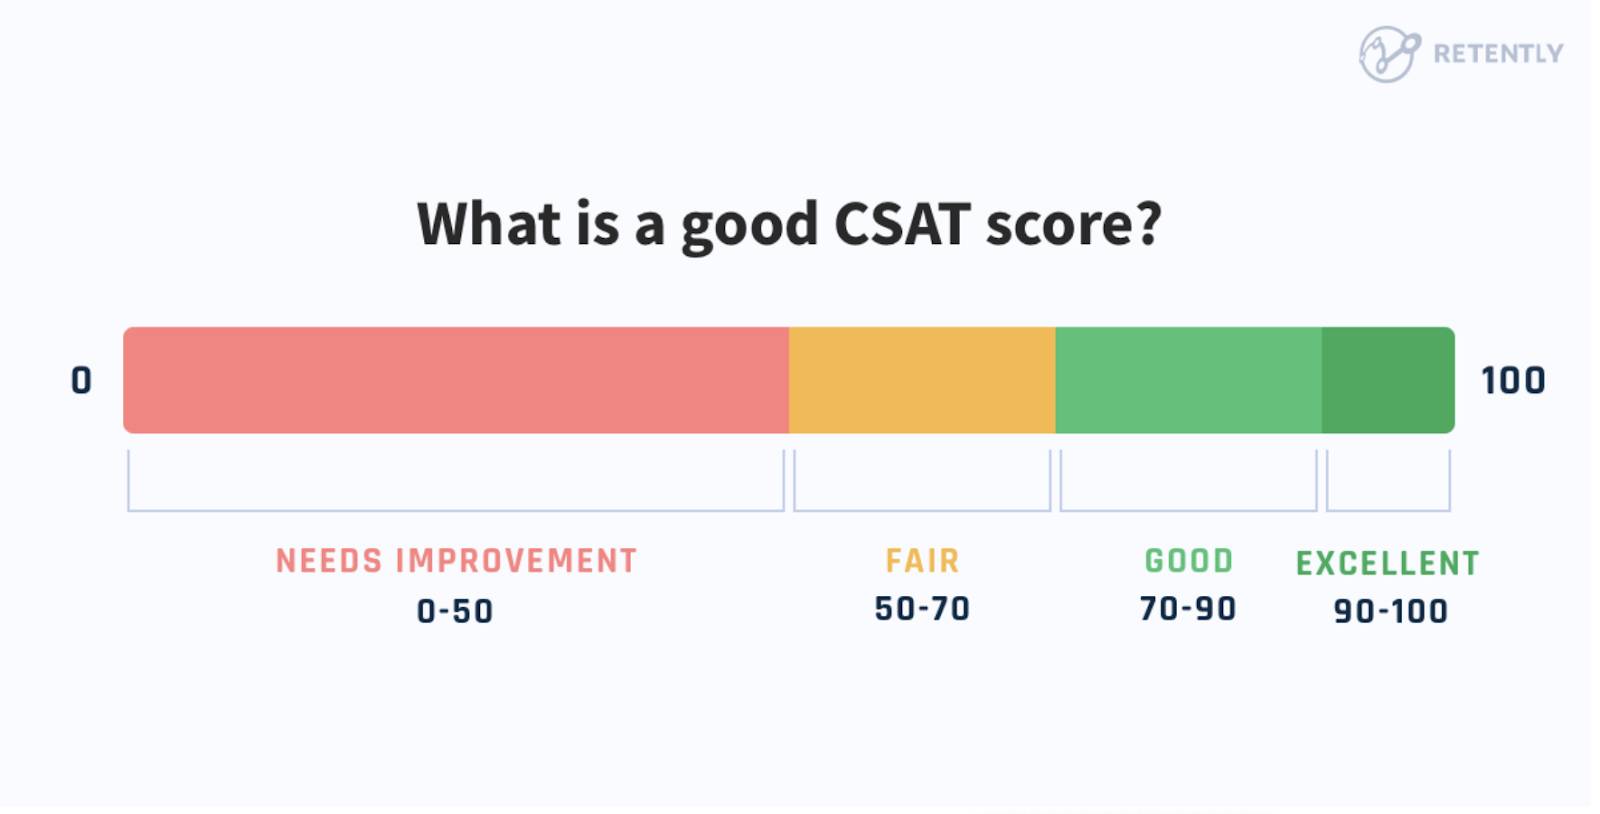
Interactions typically include:
Support tickets or help desk requests
Onboarding sessions or training calls
Product purchases or feature activations
Live chat, email or phone support conversations
Why it matters: A high CSAT score suggests that your customer support and service processes are effective. Low scores may indicate gaps in communication, long resolution times or unmet expectations.
Tip: Send CSAT surveys immediately after key interactions. Timing makes the feedback more accurate and actionable.
Customer Effort Score (CES)
Customer Effort Score (CES) measures how easy it is for customers to complete a task, like resolving a problem, placing an order or getting support.
This metric is based on a single question: “How easy was it to complete your request?”
CES is often measured on a scale from 1 (very difficult) to 7 (very easy). The lower the score, the more friction the customer experienced during the interaction.
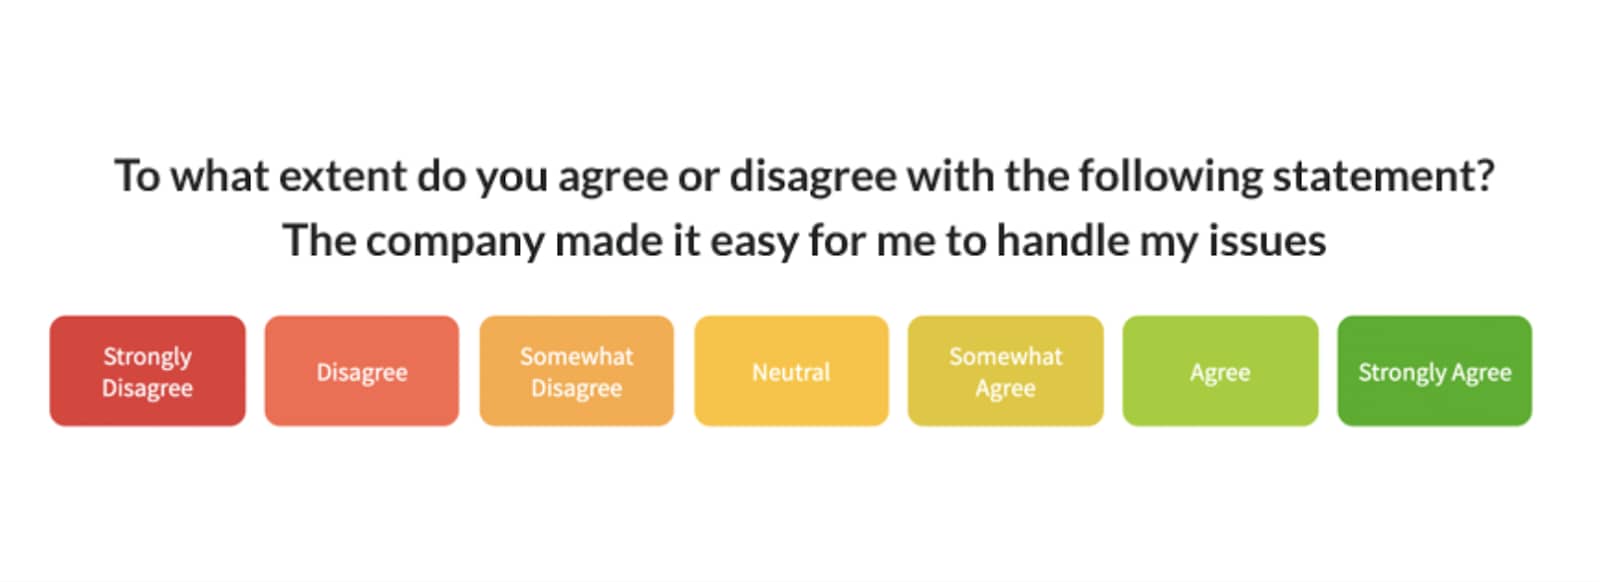
Why it matters: Customer Effort Score (CES) highlights friction in your customer experience. When processes feel difficult, churn risk increases, often before it shows up in other feedback.
You can use CES data to optimize your workflows, support tools and CRM automations. When customers don’t need to chase answers or repeat themselves, retention and loyalty improve.
Track CES regularly to reduce churn and build a more seamless customer experience.
First contact resolution rate
First contact resolution (FCR) rate measures how often customer issues are resolved during the first interaction without requiring follow-ups or escalations.
It’s a strong indicator of efficiency and overall customer experience.
A high FCR rate shows that your support team has the tools, knowledge and authority to solve problems quickly. A low rate may suggest process gaps, unclear documentation or handoff delays.
Why it matters: Tracking FCR in your CRM helps identify patterns, such as:
Which issue types are more difficult to resolve on the first try
Which reps may need additional training or resources
How different channels (chat, phone, email) compare in resolution speed
Whether certain workflows or handoffs cause unnecessary delays
It also contributes to higher CSAT and reduced customer churn.
Average resolution time
Average resolution time tracks how long it takes to fully resolve a customer issue from the moment it’s reported.
It reflects your team’s efficiency and the complexity of the problems being handled.
How to track it:
Record the time the issue is first logged in your CRM system
Record the time the issue is marked as resolved
Subtract the start time from the resolution time to calculate the duration for each case
Average these times across all tickets in a specific period to monitor overall performance
For example, if five tickets were resolved in 2 hours, 4 hours, 6 hours, 8 hours and 10 hours, the average resolution time would be 6 hours.
Why it matters: Shorter resolution times generally lead to higher customer satisfaction, while long wait times can frustrate customers and increase churn risk.
Segmenting this metric by ticket type, channel or customer tier helps you see where delays occur and how to address them.
Renewal rate
Renewal rate measures how many customers choose to continue their subscription or contract during a given time period.
It’s a key metric for recurring revenue businesses that depend on long-term customer relationships.
Formula: Renewal Rate = (Number of renewals ÷ Number of contracts up for renewal) × 100
Why it matters: Renewal rate shows how much long-term value customers see in your product. A strong rate signals satisfaction, loyalty and effective account management, making it a critical metric for sustaining and forecasting recurring revenue.
How to measure and track CRM metrics with Pipedrive
Tracking CRM metrics only works if your data is accurate, consistent and accessible.
Without the right tools, sales and marketing teams may waste time chasing leads, miss key follow-ups or overlook customer churn signals.
That’s where a CRM system comes in.
A strong CRM platform like Pipedrive centralizes customer interactions, automates routine workflows and delivers real-time visibility into your sales pipeline. It helps you track the metrics that matter without relying on manual updates or scattered spreadsheets.
Pipedrive is a CRM system designed for sales-focused teams, helping small and mid-sized businesses track deals, measure performance and improve conversion rates.
It includes built-in reporting, customizable dashboards and sales automation features that simplify tracking metrics like lead response time, pipeline velocity and customer retention rate.
Let’s look at ways to use Pipedrive to track core CRM metrics.
Pipedrive in action: AI bees is a B2B lead generation company based in Switzerland that combines human outreach with automation to deliver qualified leads. As the company scaled, it needed a CRM that could support its growing team and global client base.
With Pipedrive, AI bees built a custom CRM setup that unified lead tracking, pipeline visibility and automation. The result: 2000% growth in two years, driven by less admin, smarter reporting and more time spent closing deals.
Visualise your pipeline with real-time dashboards
Pipedrive’s sales dashboards and reports make it easy to track key sales metrics, such as close rate, sales cycle length, pipeline value and deal conversion rate.
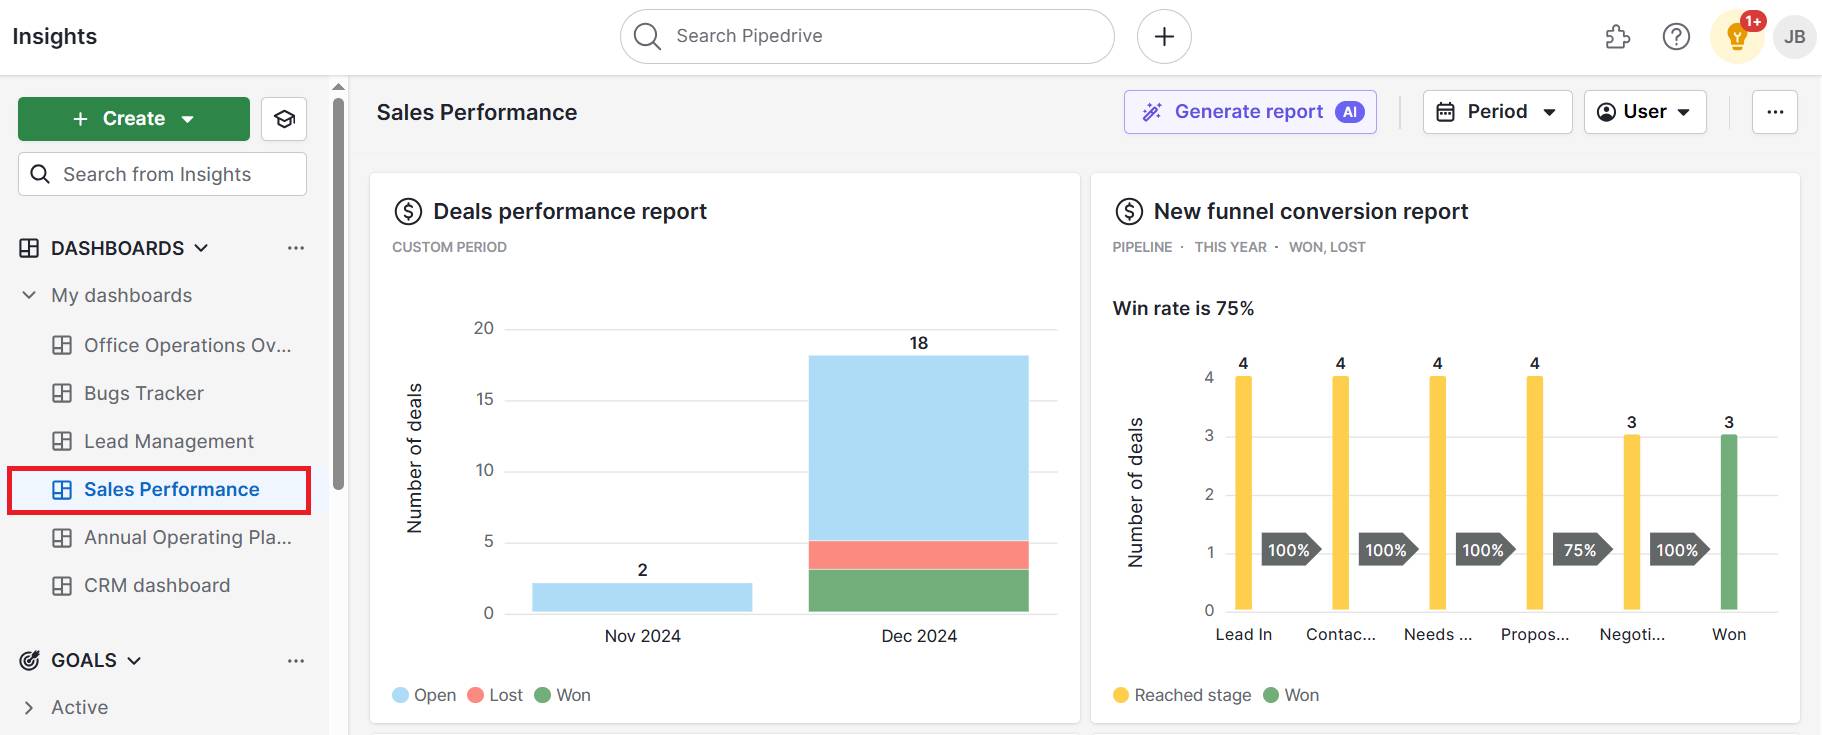
You can view metrics by team, rep, deal stage or time period to spot trends and compare performance.
To create a sales dashboard, go to the Insights tab, click the “+ Create” button and select “Dashboard” to create a new one.
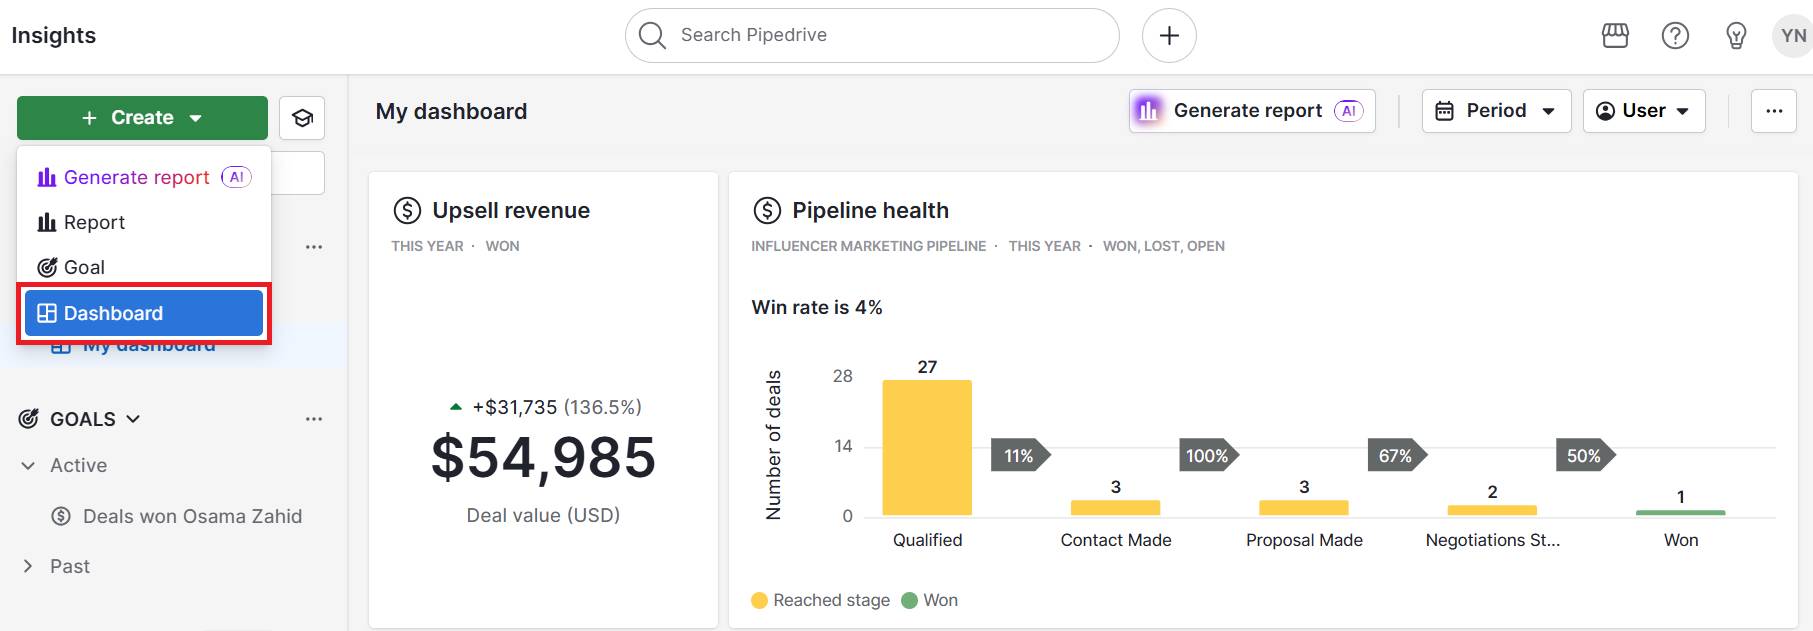
Add reports by dragging them from the left panel or opening a report and clicking “Add to dashboard”.
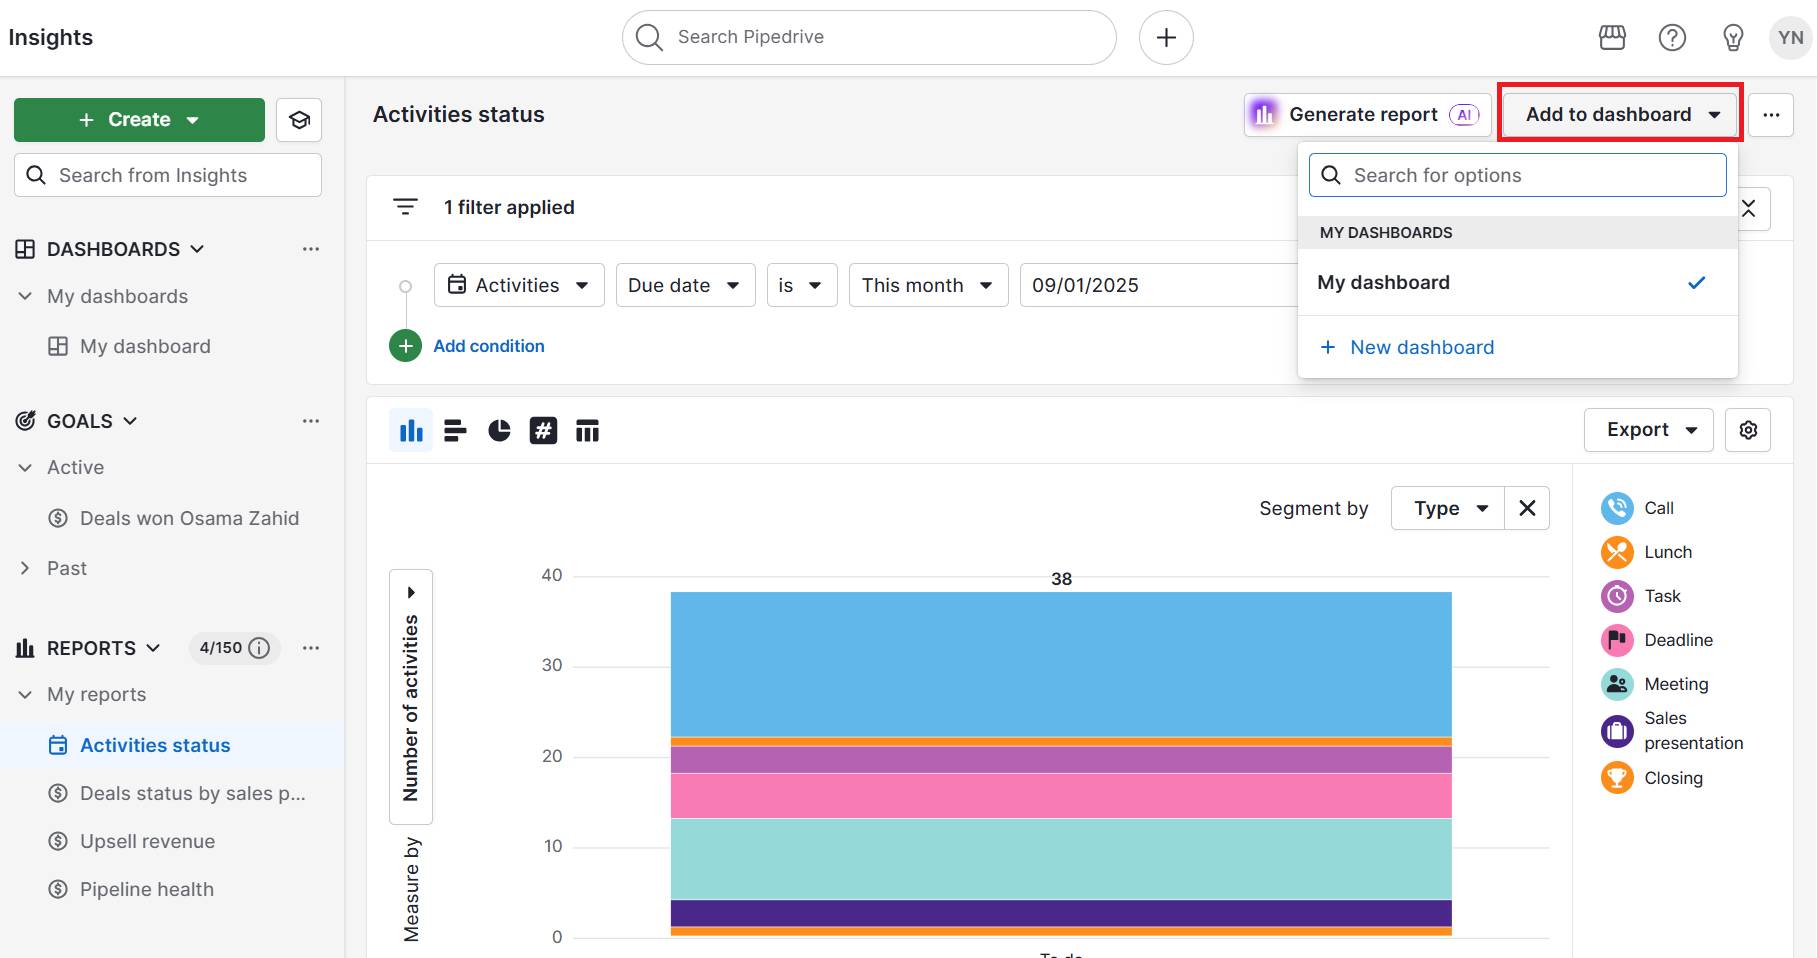
Arrange and resize your reports using the move and resize icons to design your layout.
With dashboards, you can turn your CRM data into clear, visual insights your team can act on.
Measure lead performance across all sources
Pipedrive helps you track lead performance across every channel, clarifying what’s working and what needs attention.
The best way to do this is through Insights reports, which let you build custom views of your lead data.
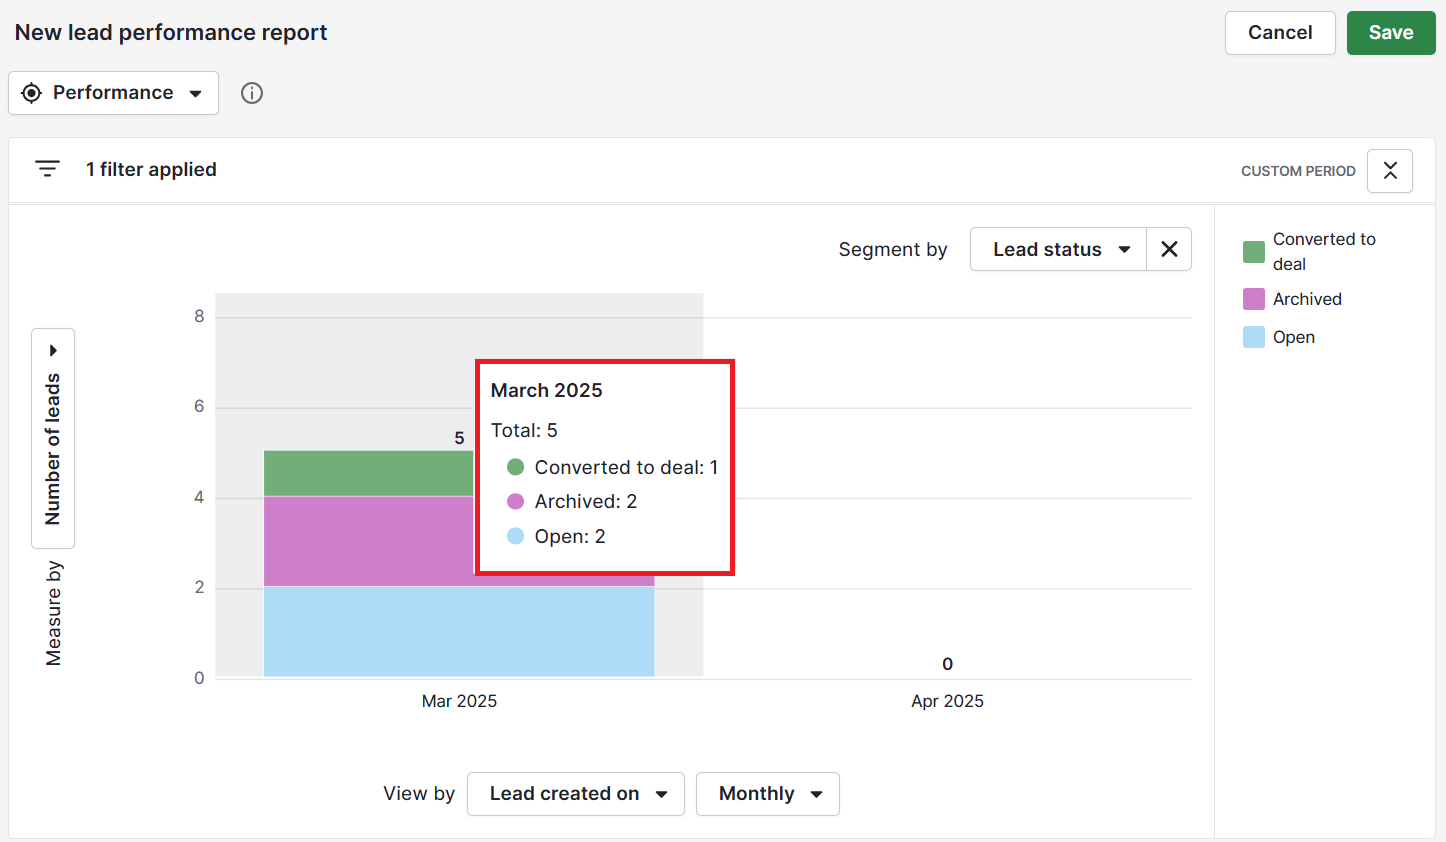
Use it to monitor:
Lead volume by source – See how many leads come from web forms, social media, outbound outreach or paid campaigns
Conversion rate by channel – Compare how well different lead sources turn into qualified deals
Lead response time – Track how quickly your team follows up with new leads to reduce drop-offs
Lead status and progress – Filter leads by stage, rep or territory to identify gaps in the sales funnel
Campaign effectiveness – Connect lead data to marketing efforts to calculate ROI and improve targeting
By centralizing lead tracking, Pipedrive helps you capture valuable insights from every prospect interaction without switching between tools.
Monitor customer retention and engagement trends
Pipedrive keeps a full history of customer interactions, making it easier to track retention and engagement over time.
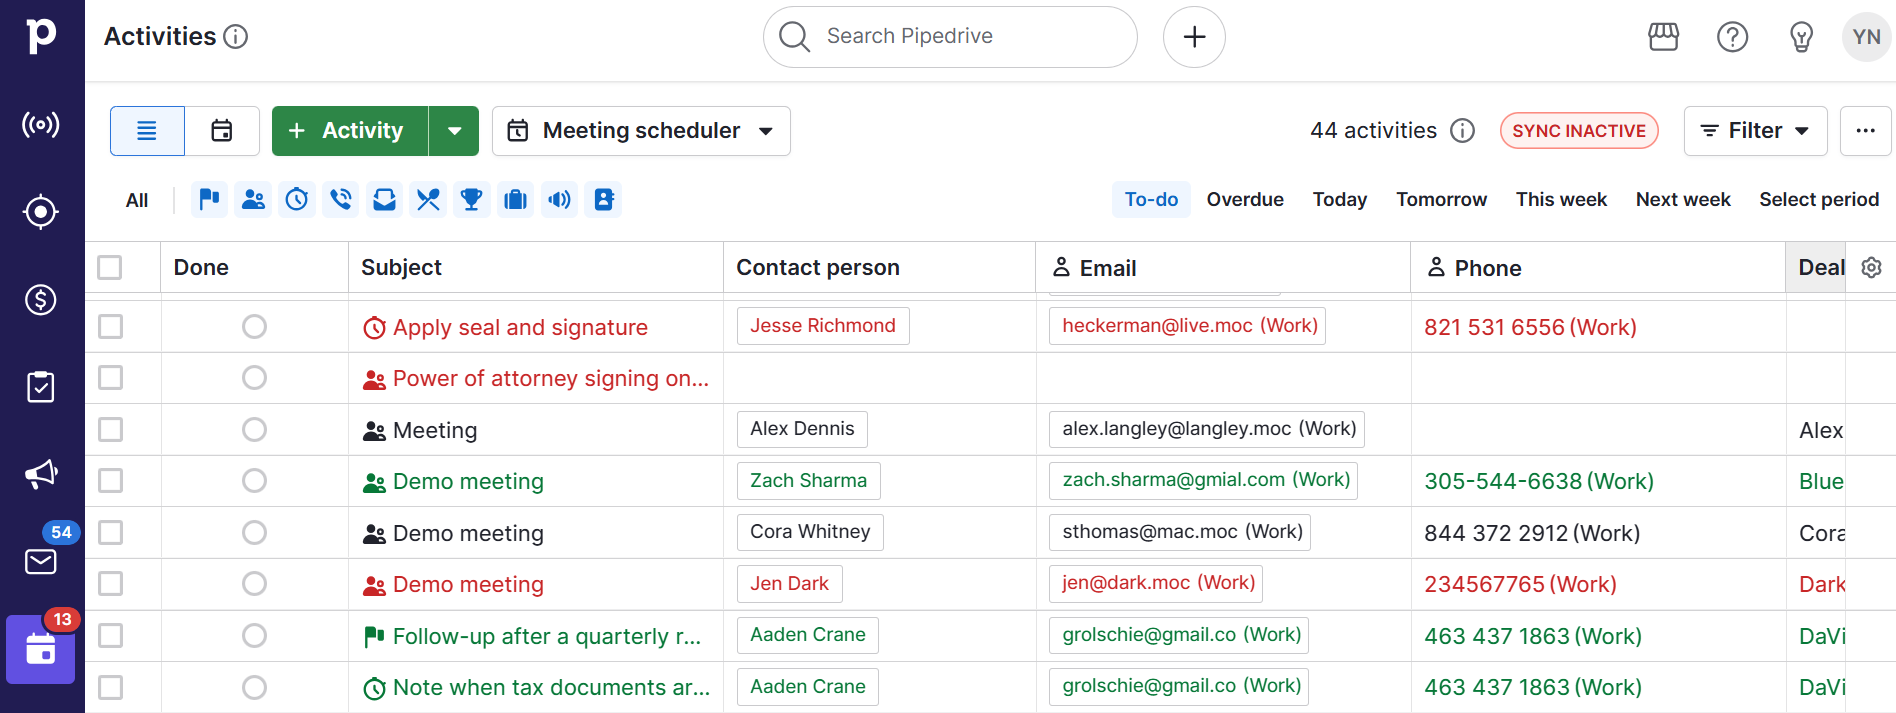
Activities lets you log every call, meeting and email as an activity to keep records organized and ensure no follow-ups are missed.
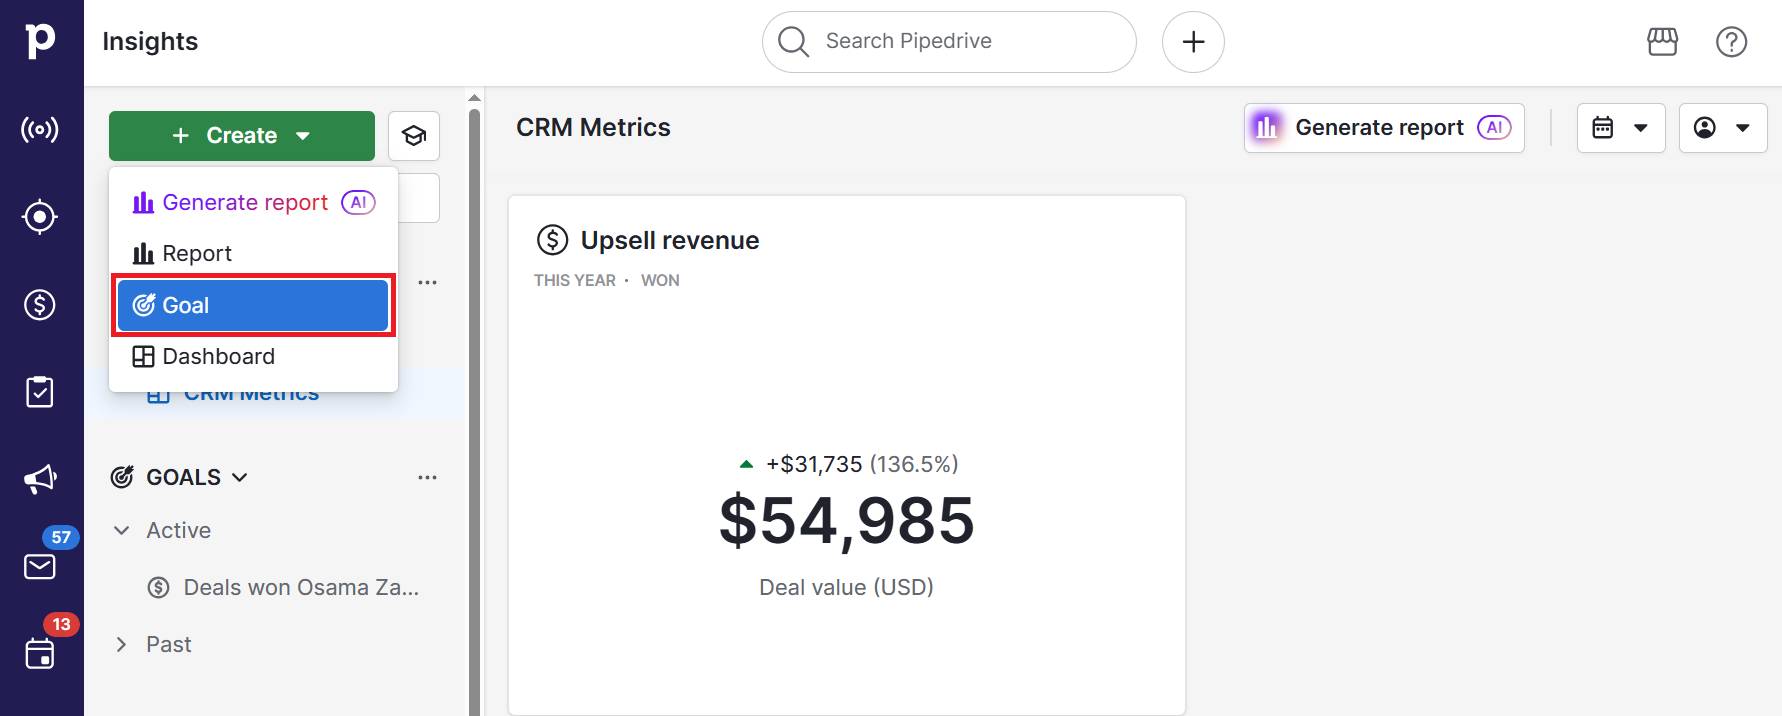
Goals allows you to set measurable targets for activities or outcomes (like number of calls made or deals closed) to track performance at scale.
Contact timelines let you view a chronological history of all interactions with a customer, giving you context for renewals, upsells and engagement trends
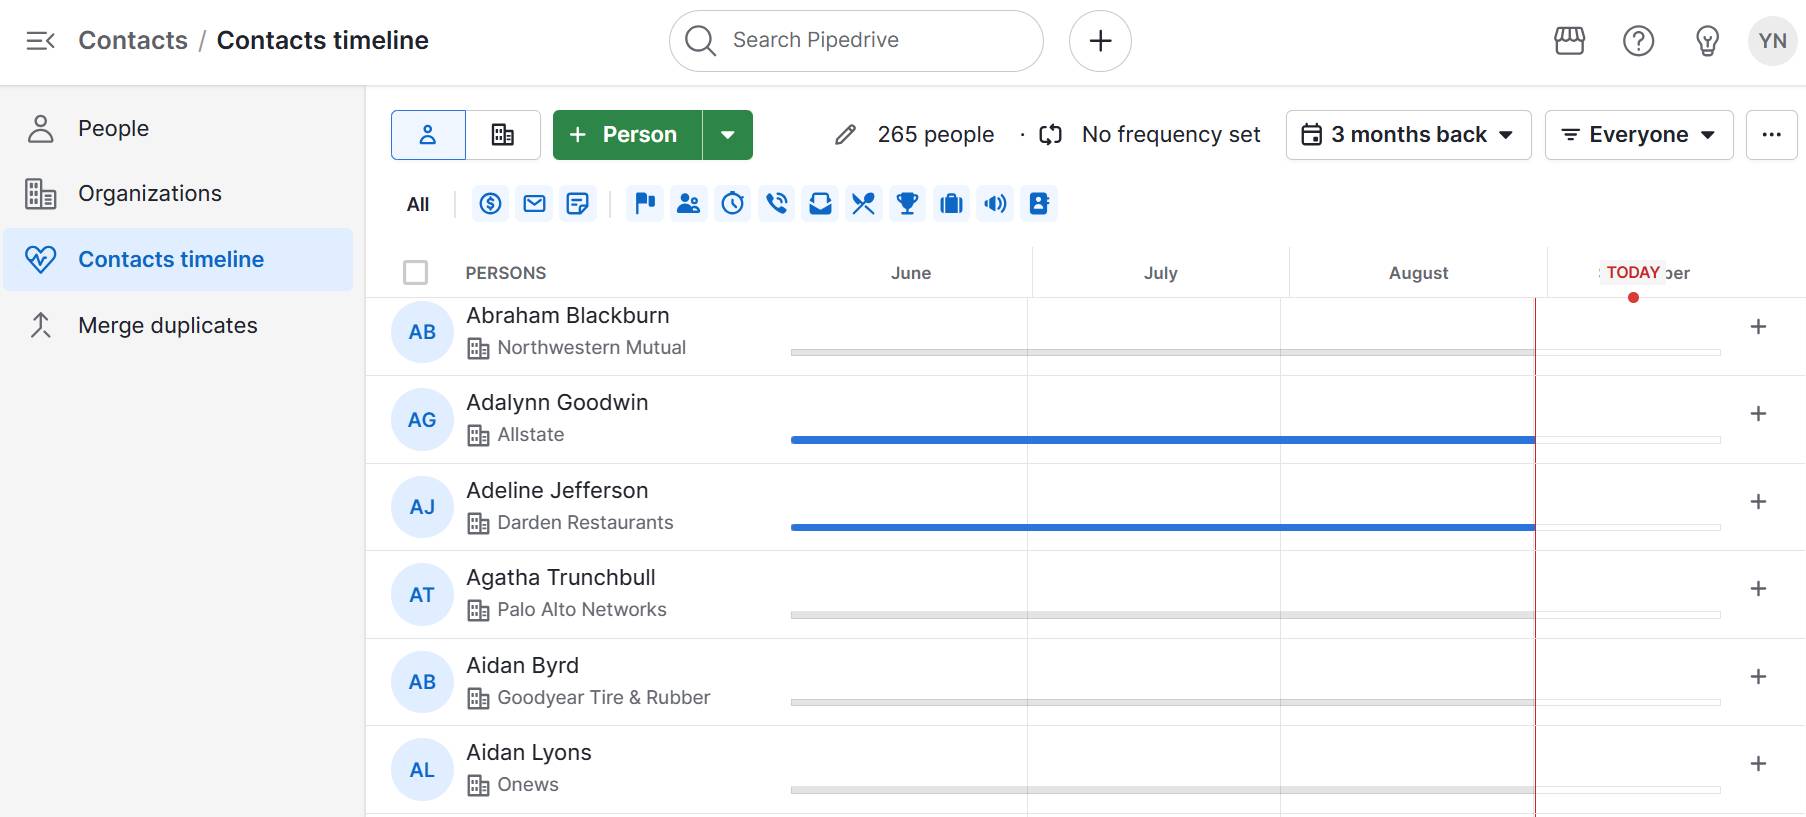
These tools work together to give you visibility into metrics like churn, renewal and upsell rates.
For example, renewal reminders ensure contract dates don’t slip through the cracks, while deal histories make it easier to spot upsell opportunities.
Final thoughts
From customer acquisition cost to churn rate, the right metrics reveal where to focus and how to grow.
Metrics only work if the data behind them is accurate, timely and easy to access, so building a clear CRM strategy is essential.
That’s where a CRM system like Pipedrive gives you an edge. With real-time dashboards, automation and built-in reporting, you can monitor what matters and act on it with confidence.
Want to track your CRM metrics more effectively? Try Pipedrive free for 14 days and see how visibility leads to better business performance.


