As a small and medium-sized business (SMB) owner, your content must work harder to grab attention among big-name brands. Even without an in-house designer or large budget, well-planned marketing infographics can engage your target audience and get them to convert.
In this post, you’ll learn how to create visual content that keeps your sales pipeline flowing and moves the needle.
What is a marketing infographic?
A marketing infographic combines data, text and design to present information in a way that’s easier to digest and more memorable. This type of visual content communicates a brand’s message quickly and clearly.
Infographics help your busy SMB showcase its value faster. Speed and clarity are crucial for capturing audiences and standing out against more established companies.
For example, here’s part of a process infographic explaining email delivery:
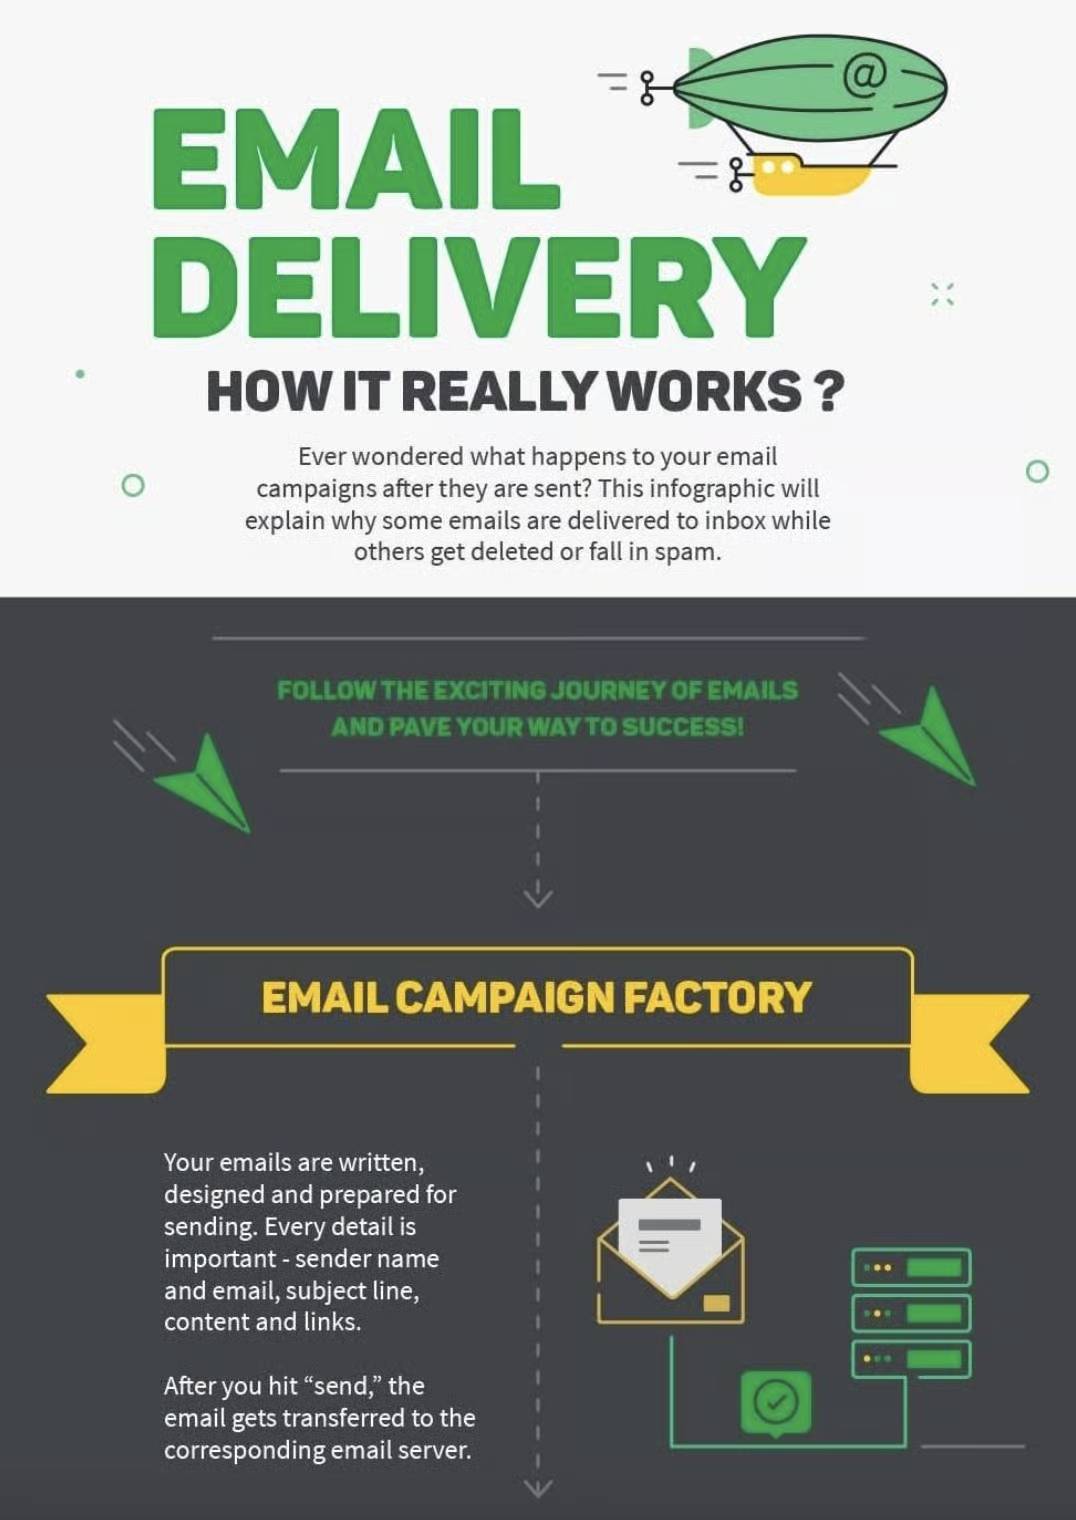
It uses simple icons and short paragraphs to simplify and make the content more approachable for readers.
Marketers typically use infographics as top-of-funnel (TOFU) content. In this “awareness” stage of your marketing funnel, people are just learning about your brand:
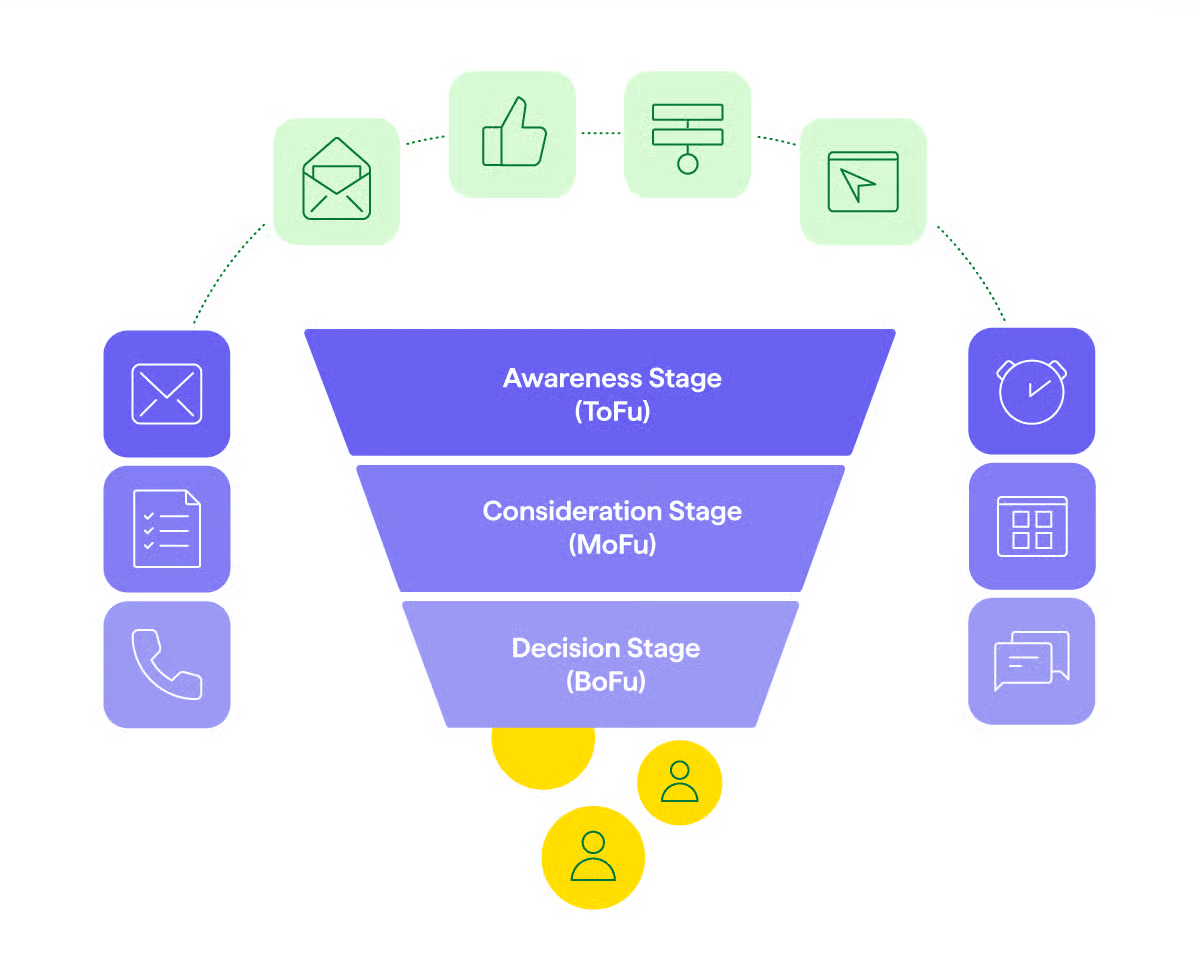
Your goal here is to grab attention and build interest (not go straight for the sale, as people aren’t ready to buy).
Infographics work well in this stage because they’re eye-catching, shareable and easy to digest. They allow potential customers to engage with your brand in a low-pressure way while still picking up useful information.
However, you can use infographics throughout your marketing and sales process to:
Explain a complex product or service
Highlight key stats or benefits of what you offer
Share the results of a customer story or case study
Recap insights from a blog post, webinar or workshop
Support a sales pitch or email with a quick visual summary
As this article shows, effective digital marketing infographics do more than just inform. They inspire people to act.
Why should SMB owners use marketing infographics?
The best infographics make your message easier to absorb, remember and act on. When every brand competes for audiences’ limited time and attention, thoughtful resources cut through the noise.
It’s no wonder Venngage reports that infographics are marketers’ most successful types of visual content:
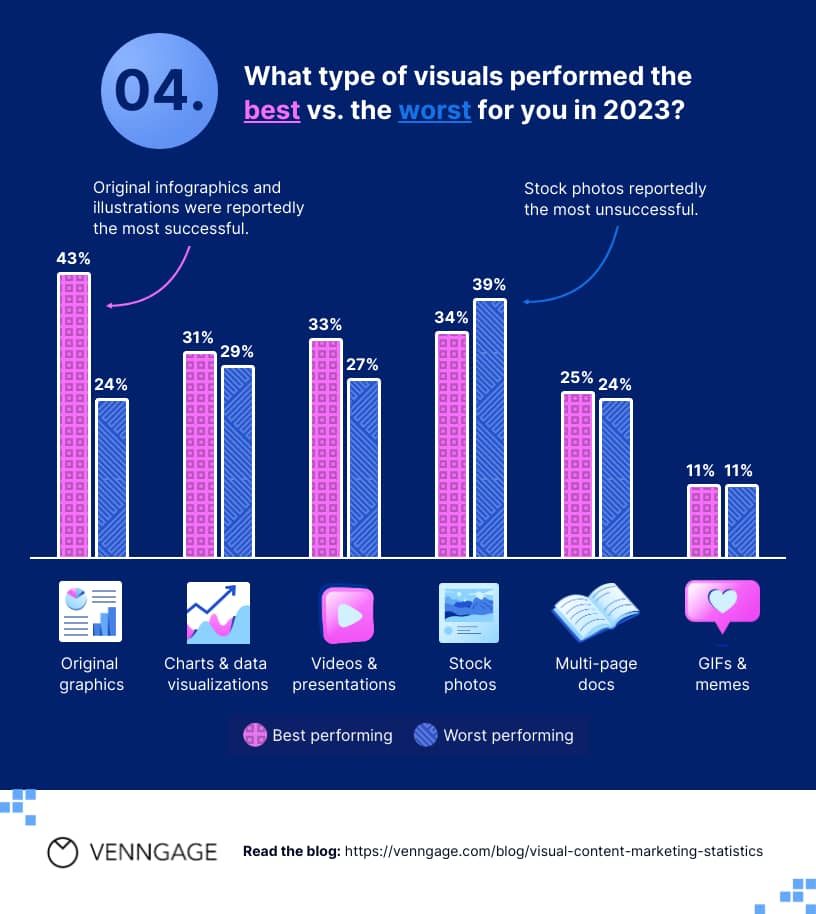
Infographics can be powerful assets in your content marketing strategy. They convey value instantly, whether you’re explaining your service or proving results.
According to Canva research, 91% of businesses use visual communication to be more efficient. Teams use it to explain ideas clearly, speed up decision-making and connect better with audiences.
Here are four key benefits of business infographics for SMB marketing:
Marketing infographic benefit | Why it works |
Increase content engagement | Infographics make complex information visually appealing and highly shareable. |
Build credibility | Sharing data-driven, visual proof of success (like ROI stats or case studies) builds trust and authority with prospects. |
Create stronger calls-to-action (CTAs) | Infographics provide clear, compelling reasons for leads to move forward with decisions. |
Save time in your sales process | Visually addressing common objections or questions helps you close more deals. |
A single infographic can also deliver value across multiple touchpoints. They’re easy to repurpose across email marketing, sales presentations and your website.
5 simple steps to create a content marketing infographic
When created intentionally, infographics become powerful tools in your content marketing efforts.
You just need to clarify why you’re making one, who it’s for and what action you want people to take after seeing it.
Here’s a step-by-step guide for using marketing infographics more effectively.
1. Define your infographic’s goal
Before you start designing, clarify what you want your infographic to achieve. A clear aim (e.g., a specific sales goal) helps you stay efficient and align your content with tangible, intended business outcomes.
Without big budgets or endless resources, every piece of content needs to pull its weight. Decide if you want your infographic to:
Educate your audience
Nurture warm sales prospects
Capture your core takeaway in one sentence. For example:
“This infographic will help potential customers understand our onboarding process, so they feel more confident booking a demo”.
Your goal aligns your team and makes every decision easier, from what data to include to where to share your infographic once live.
Here’s how to determine yours:
Identify which customer journey stage the infographic will support (e.g., brand awareness, consideration or decision) to shape the message and tone
Choose one clear objective to give it purpose (e.g., explaining a product benefit, showcasing a success story or simplifying a common process)
Decide how you’ll measure impact (e.g., through downloads, email sign-ups, click-throughs or time on page), so you know if the infographic is achieving its goal
By setting a target and success indicators, you’ll build strategic assets that support a broader marketing plan.
2. Identify the target audience
A compelling infographic speaks directly to specific customer needs, questions or pain points. For example, you may target decision-makers from specific company sizes or existing leads who have yet to convert.
When you know your customer, you can tailor every infographic component (i.e., language, tone, visuals and data points) to what matters most to them.
Narrowing your focus also helps make your message more effective and actionable. For instance, this Smart Insights infographic lays out the inbound marketing funnel:
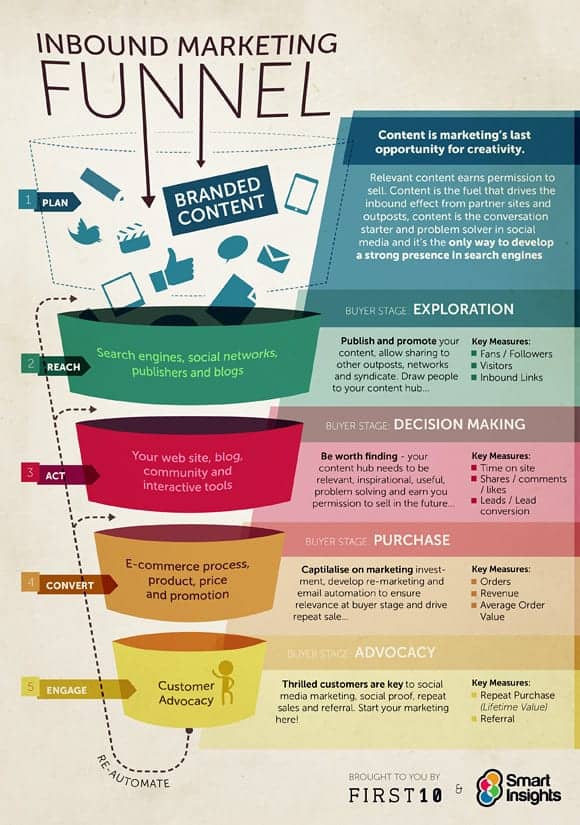
The company targets business owners at SMBs who want to drive downloads, demos and sales with their content marketing. By positioning itself as a trusted resource, Smart Insights increases the likelihood that readers will convert when they’re ready to invest in a membership.
Your customer relationship management (CRM) software is a goldmine for finding key audience information.
Let’s say you use Pipedrive to store key contact data.
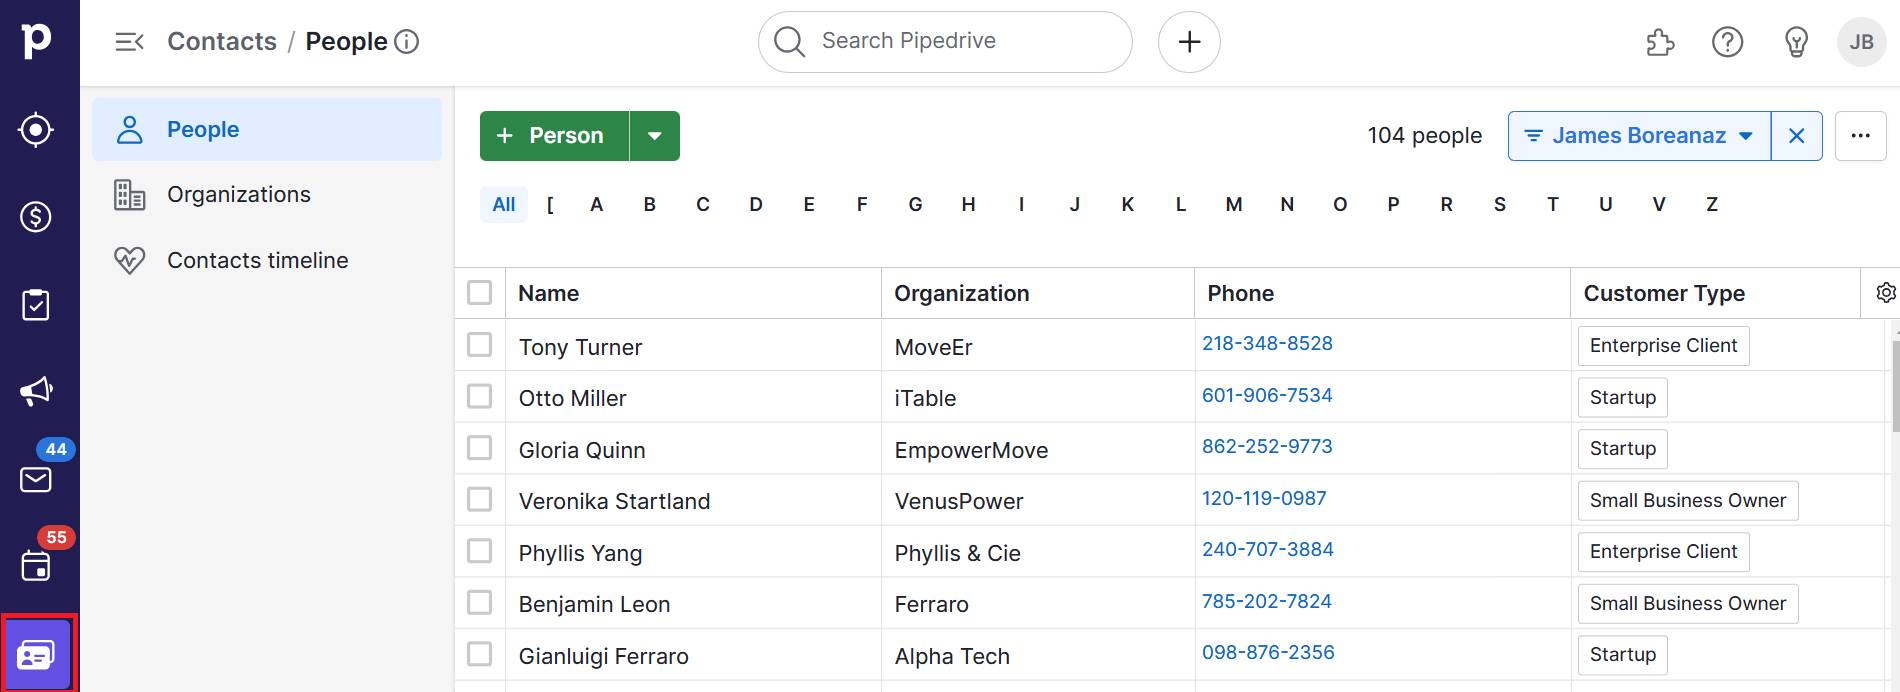
You can identify individuals by organization and customer type (as above) or even by job roles, industries, pipeline stages and interaction history. These details help you build clearer customer segments on which to base infographics.
For example, you might categorize:
Leads in the “evaluation” stage who’ve asked about pricing details
Healthcare operations managers who downloaded a specific how-to guide
CEOs from manufacturing companies who clicked on a recent email campaign
Reviewing FAQs or sales conversations also helps you spot recurring questions or objections that could become infographics.
The more specific your target audience, the more likely your content is to resonate and drive results.
Better understand your customers with our Buyer Persona Templates
3. Collect relevant data
Your marketing infographic needs relevant, accurate information to attract and convince potential customers.
In fact, Venngage research also suggests data visualizations are marketers’ most popular type of visual content. The right stats give your infographics credibility, while also showing you understand readers’ real challenges.
In the example below, the project management tool Asana highlights stats from its original research:
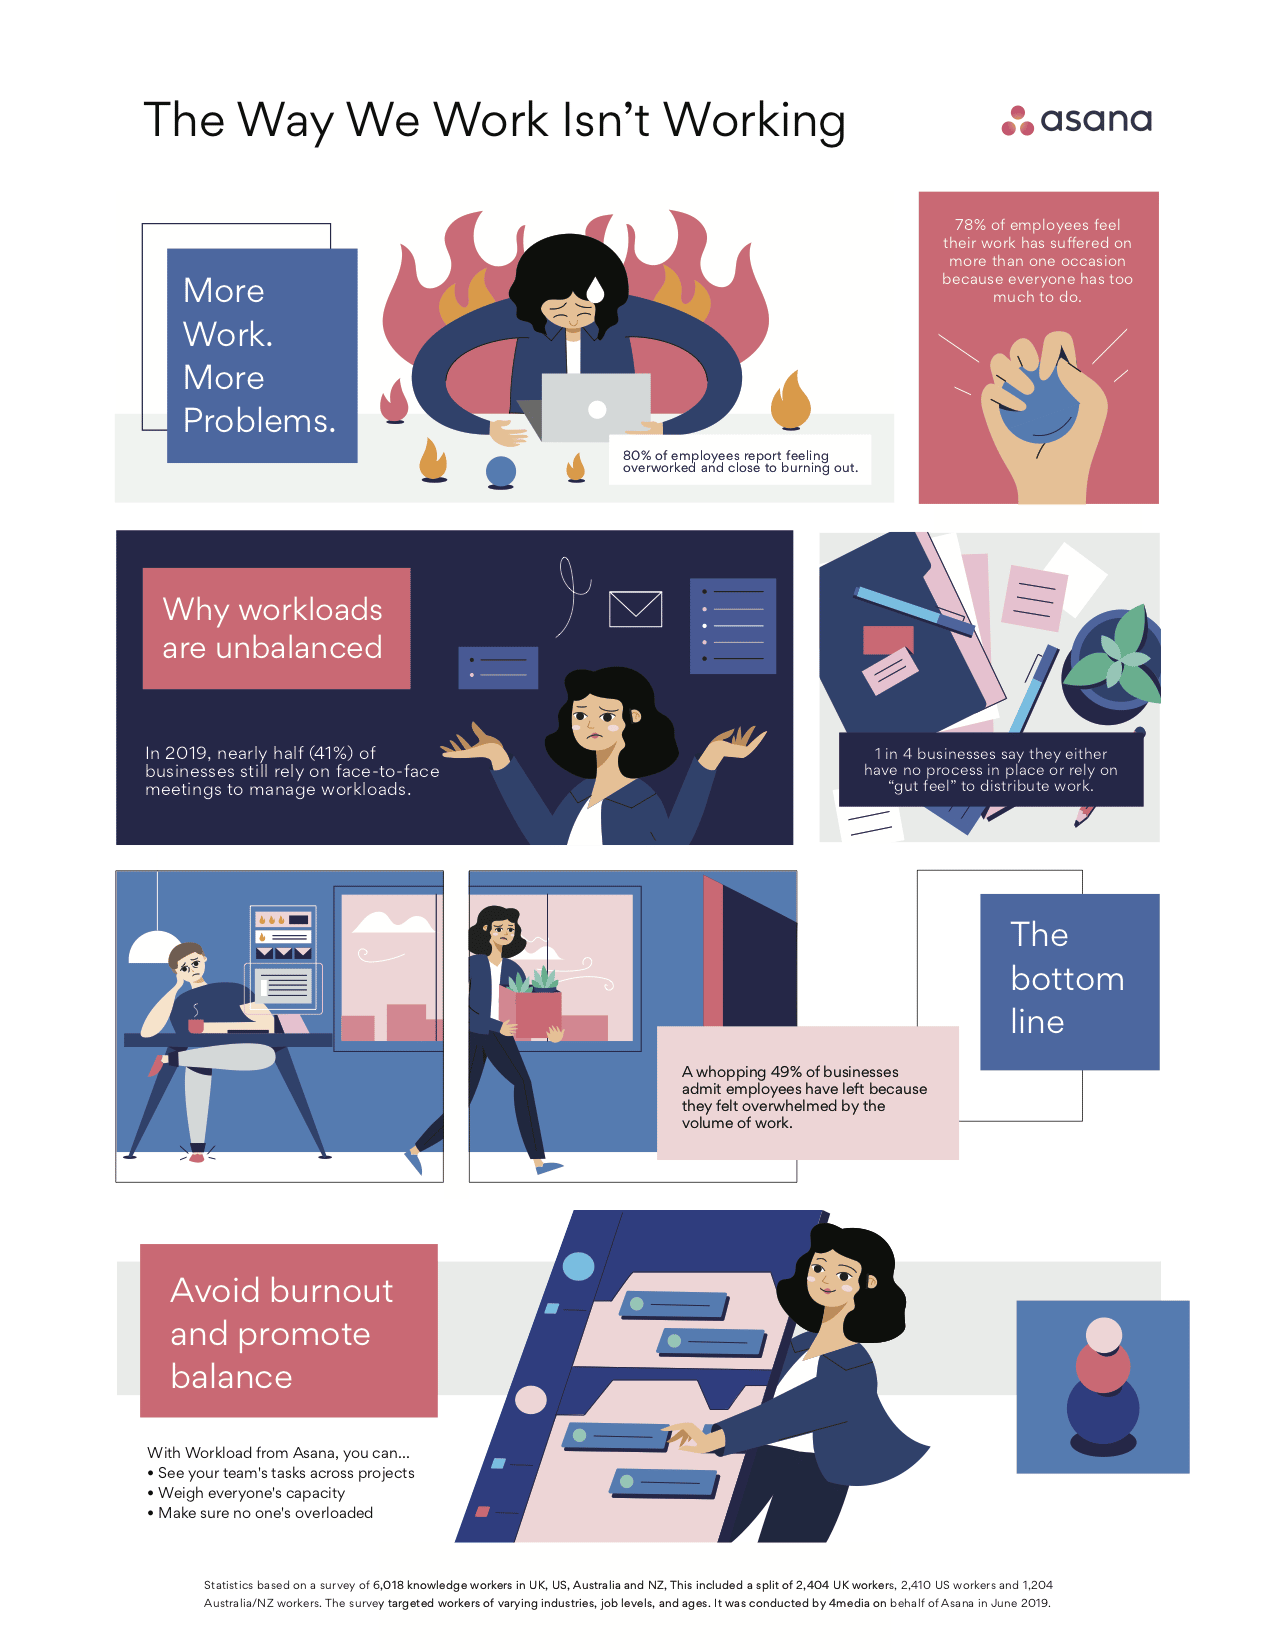
Instead of reading through a wordy report, readers understand the story the data is telling at a glance.
Your segments guide the theme and content of your infographic. To find the best-fit data, think about what information each audience needs to take the next step. What’s holding them back?
Determine what data you can gather to:
Address common objections
Highlight a success story from the same industry
Break down how your product solves an operational pain point
Once you’ve pinpointed the type of insight you need, find it. You likely already have a lot of valuable data at hand – you just need to know where to look.
Here’s how to collect relevant customer and market information:
Where to look | What you can learn |
CRM system (e.g., Pipedrive) | Identify sales trends, common challenges or successful outcomes you can showcase |
Database notes and call recordings | Find real customer stories of feedback |
Support tickets and FAQs | Spot recurring user issues or questions |
Performance metrics | Demonstrate your product’s impact on customers (e.g., time saved or revenue growth) |
Industry statistics or market research | Add context or topical authority |
For instance, say you run a B2B software company that helps mid-sized logistics firms improve fleet efficiency.
Your sales team has been filtering won deals in your CRM for the past six months. It notices that 70% of successful clients had the same pain point: tracking fuel usage. Notes and call recordings also reveal that compiling reports was a major frustration.
To create an infographic, you gather:
A customer quote from a recent demo about time savings
Internal data showing a 30% reduction in fuel costs after three months
Industry research about rising fuel prices in the logistics sector
Including this information validates your product’s value and directly addresses a high-priority concern for similar prospects.
Using data that matters to your audience makes your infographic feel trustworthy and persuasive. These two things help move leads closer to a decision.
4. Choose a tool with infographic templates
A tool with ready-made templates saves time and ensures your content looks clean, engaging and on-brand. You won’t need an in-house team or freelance designers to create polished and professional infographics.
For example, Canva offers a beginner-friendly drag-and-drop editor across millions of templates:
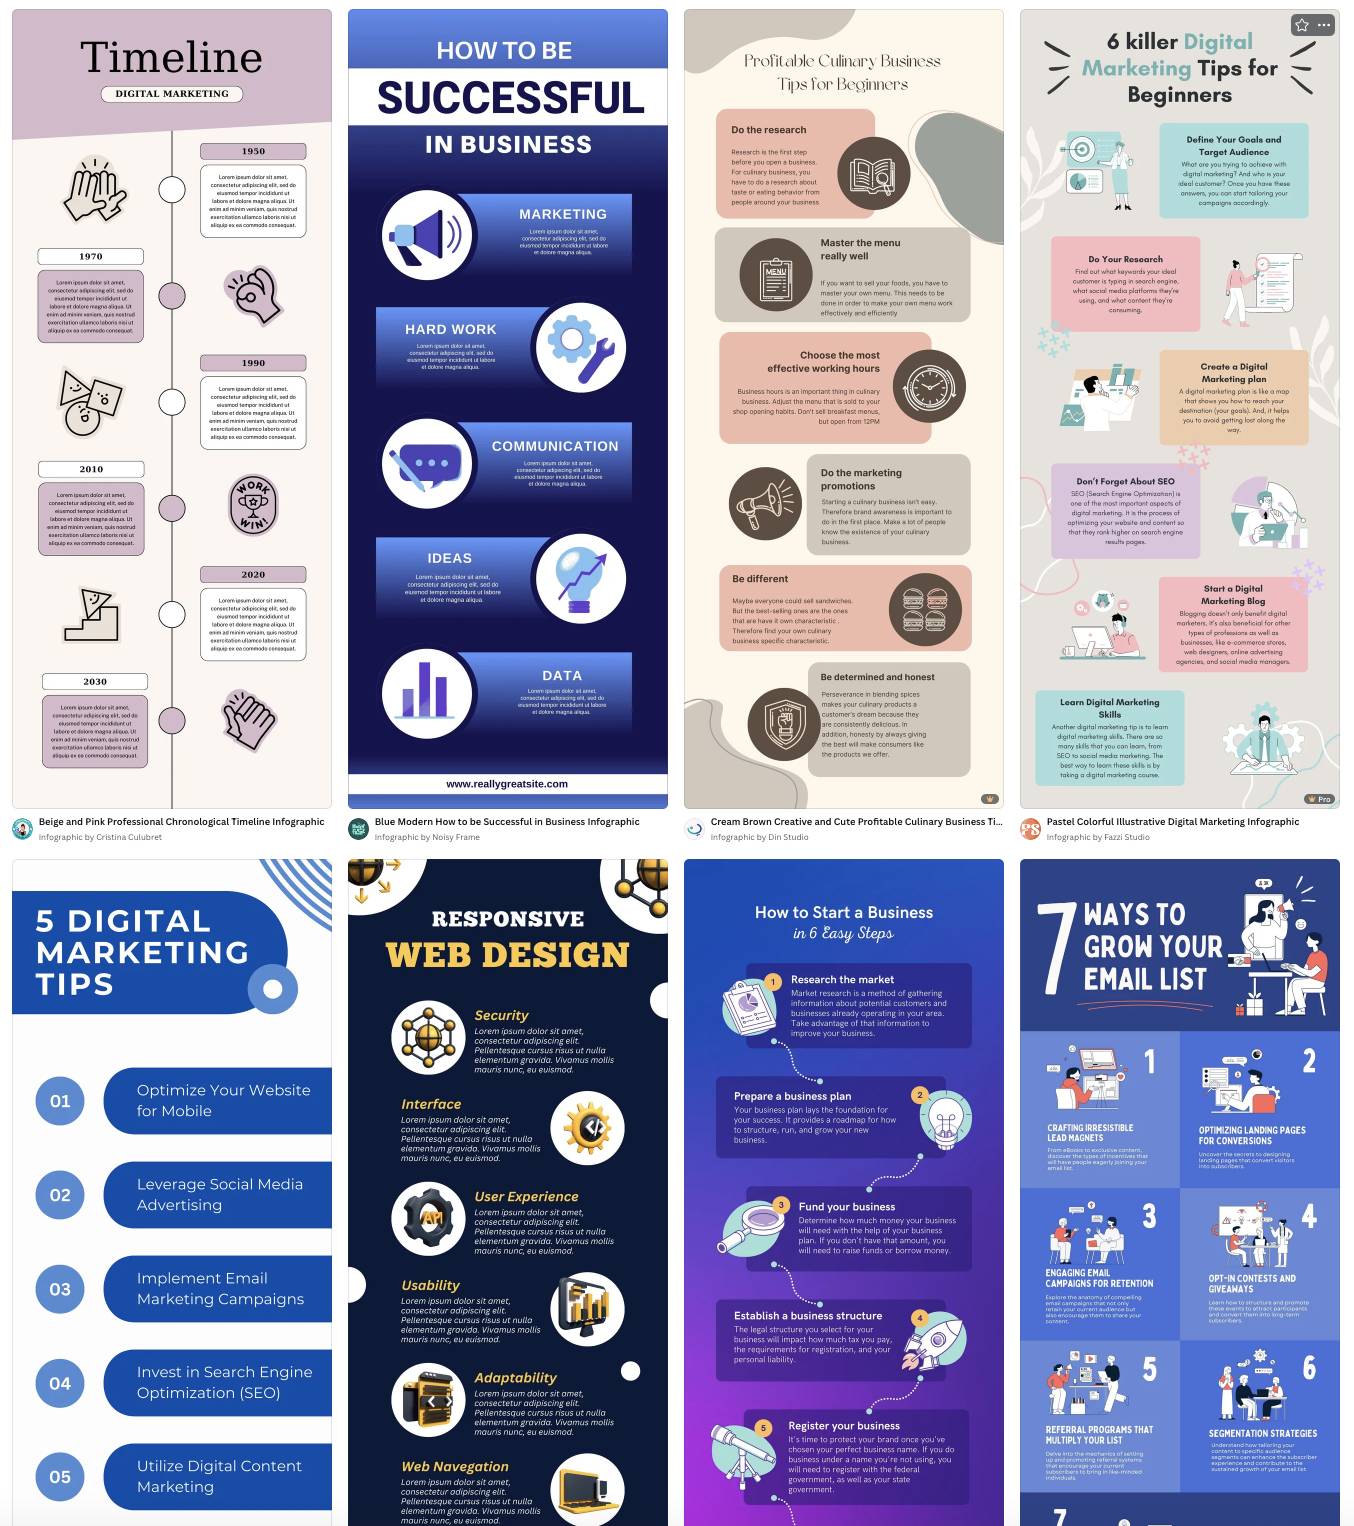
It’s especially handy for social media marketing. Pre-set dimensions for every major platform and brand kits keep your visuals consistent.
Other popular design tools with infographic templates include:
Venngage – for more data-heavy visuals, with options to visualize charts and stats
Piktochart – offers templates designed for marketing, presentations and reporting
Visme – ideal for interactive infographics and more complex visual content
Templates can also inspire your own infographic designs, so you never have to sit staring at a blank page.
When choosing an infographic marketing tool, pick one that:
Offers templates for different content types (like timelines, comparison charts or process breakdowns)
Lets you easily customize fonts, colors, icons and layout
Allows collaboration if your team is working together on design and approvals
Provides download and sharing options for web, email or print
Start with a layout that fits your goal, then update the content and colors to match your brand style and audience needs.
5. Share through content marketing efforts
Sharing your infographic through the right content marketing channels helps you reach your audience and guide them further along the buyer journey.
Thoughtful distribution ensures your infographic gets the attention it deserves and drives real results.
First, focus on the channels where your audience is already active, such as your email list, blog or social media. Think about how your infographic fits into your existing marketing campaigns when choosing where to share it.
For example, see if it would work as part of a:
Lead-nurturing email sequence, reinforcing key points after a sales demo or consultation
Blog post to boost time on page and engagement
LinkedIn post, paired with a brief caption or a clear CTA
Before publishing, consider the best format and dimensions for each platform. A long, vertical email infographic that looks great as a newsletter might cut off or prove hard to read on Instagram.
For instance, this horizontal Unbounce “landing page rehab” infographic is ideal for how-to guides and presentations:
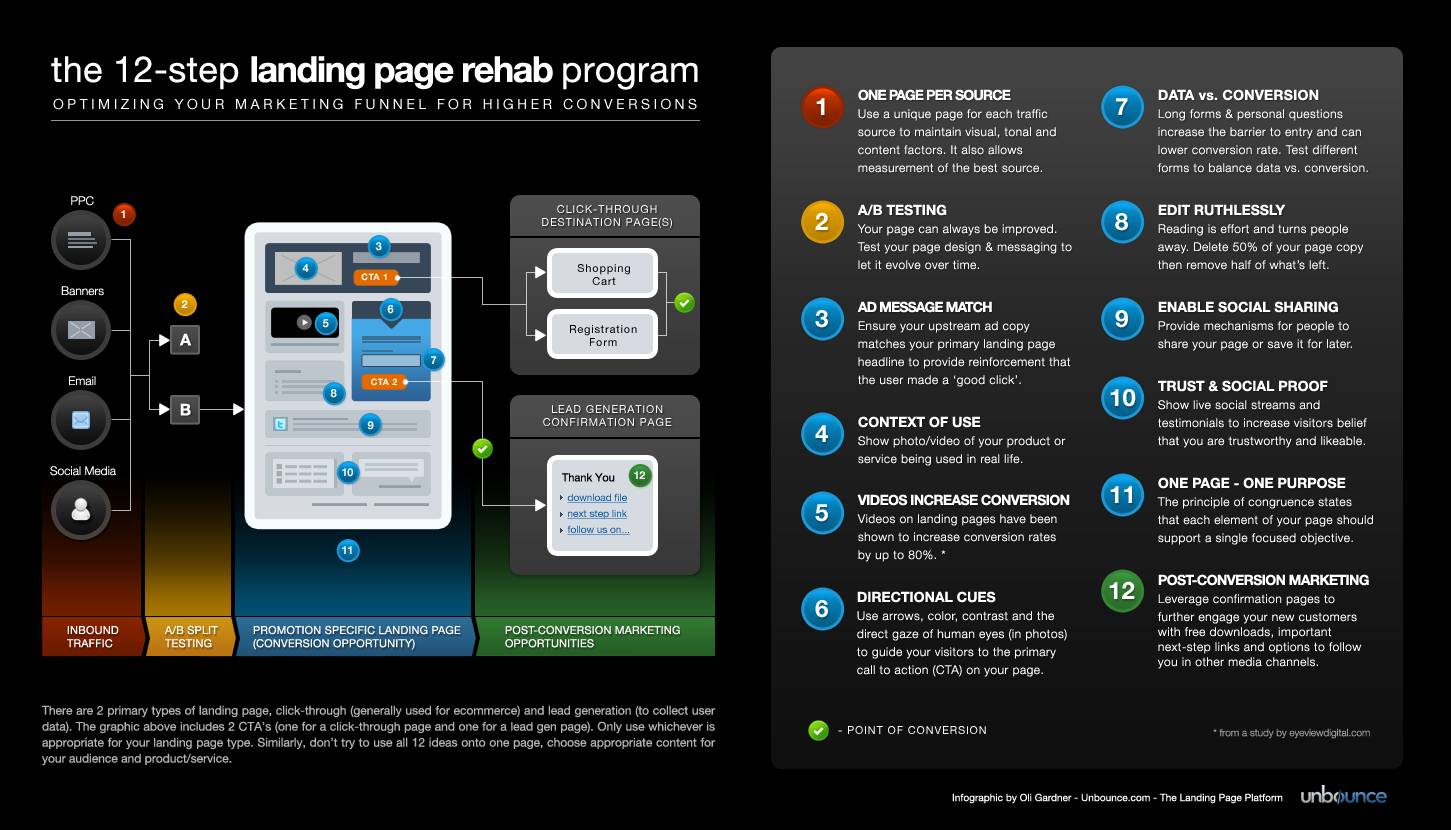
On the other hand, square or vertical formats perform better on specific social media platforms (like X) and smaller mobile screens.
Remember, one infographic can become an article, several social posts, a slide deck or a downloadable lead magnet. Repurposing drives more value from every piece of content.
Partner with influencers or other businesses to share your infographic. You’ll expand your reach and build credibility through trusted networks.
How to use marketing infographics as part of your Pipedrive sales process
Marketing infographics can support your entire sales funnel, especially during the lead-nurturing phase. A CRM like Pipedrive provides the tools to deliver the right content at the right moment.
First, create contact labels to group people and organizations based on deal stage, interest level or past engagement:
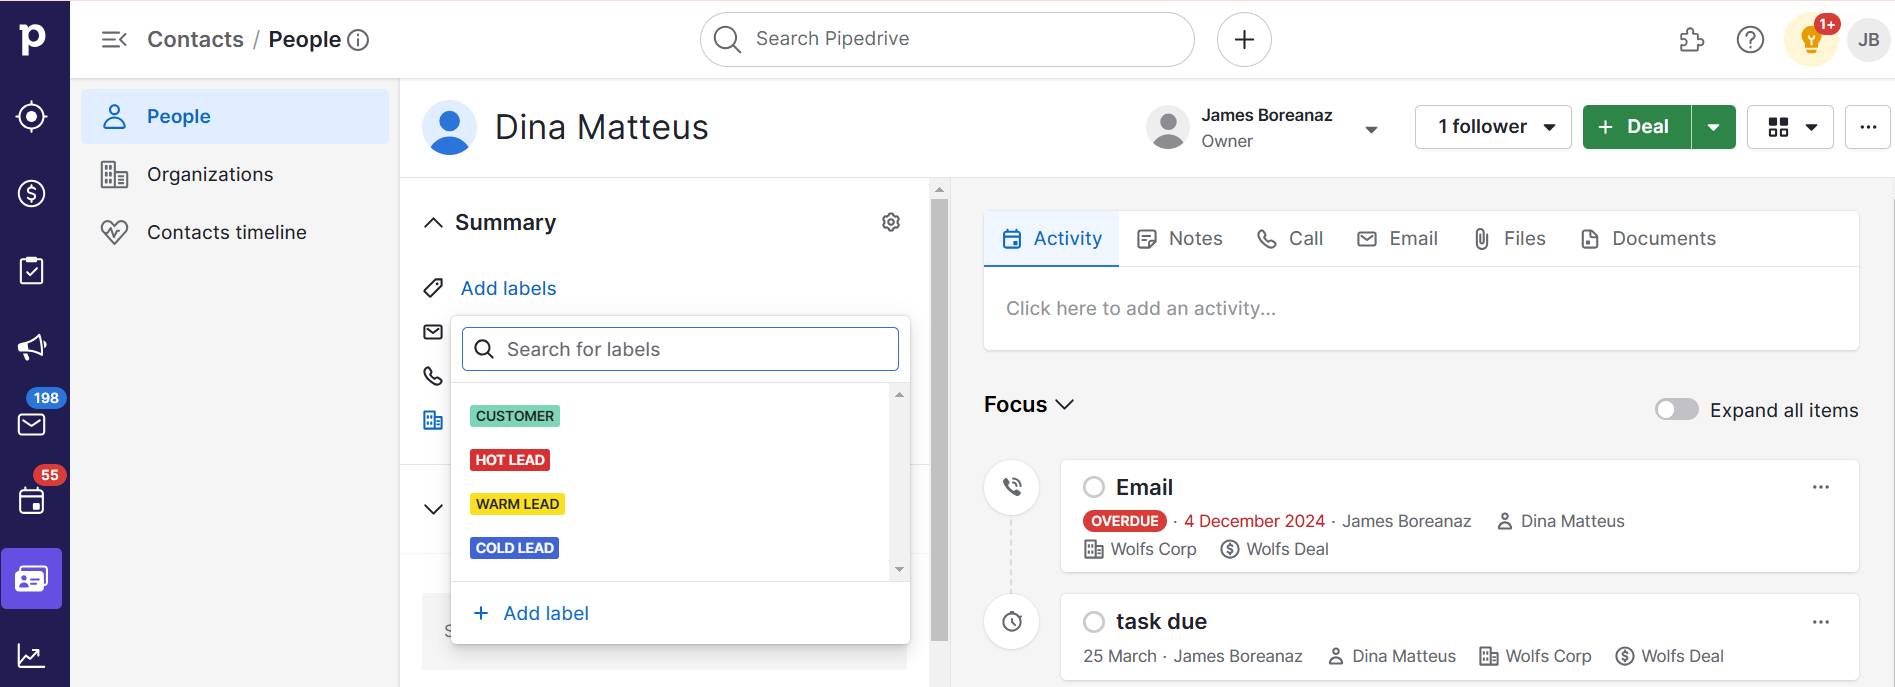
This intent and behavioral segmentation lets you tailor your infographic content to speak directly to each group’s interests or concerns.
Next, build sequences of personalized emails using Campaigns by Pipedrive:
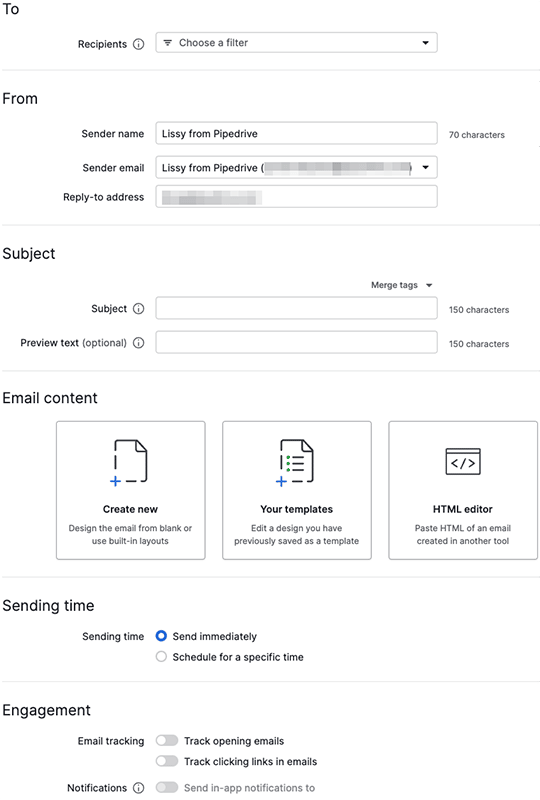
For example, set up a series for warm leads with a comparison infographic that helps clarify your value over a competitor’s. Or design one to send alongside a customer success story from their industry.
Then, let Pipedrive’s workflow automations send infographics at strategic points. A good opportunity is right after a product demo or consultation:
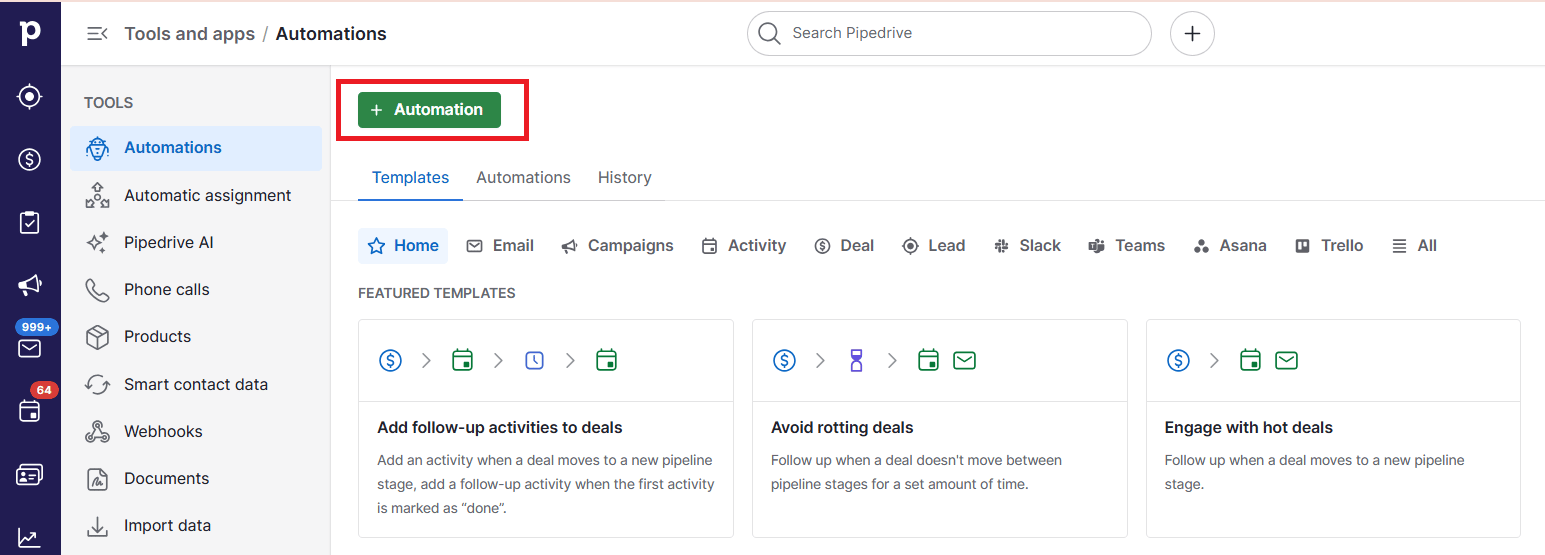
Reinforcing your message with a visual keeps your solution top of mind without manual follow-ups.
Once you send emails, track how leads engage with them using Pipedrive’s Insights for Campaigns:
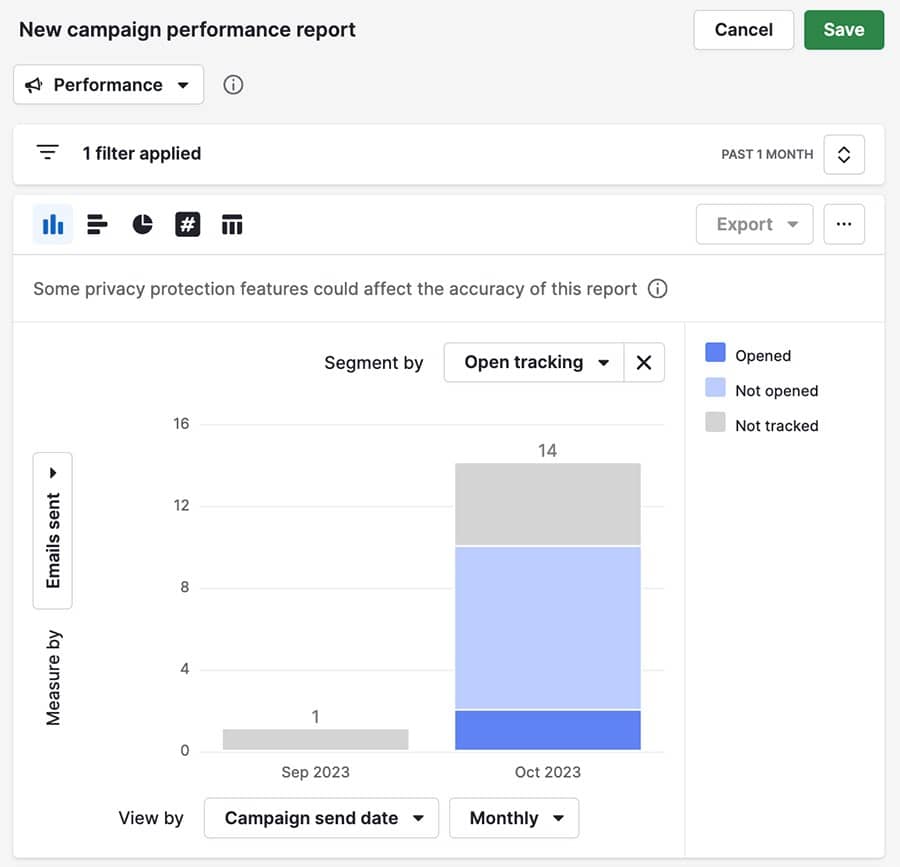
Look for improved (or declining) email opens, clicks and conversion rates tied to infographic content to guide your future efforts.
You can also run Pipedrive’s AI report generator to ask for insights in your own words:
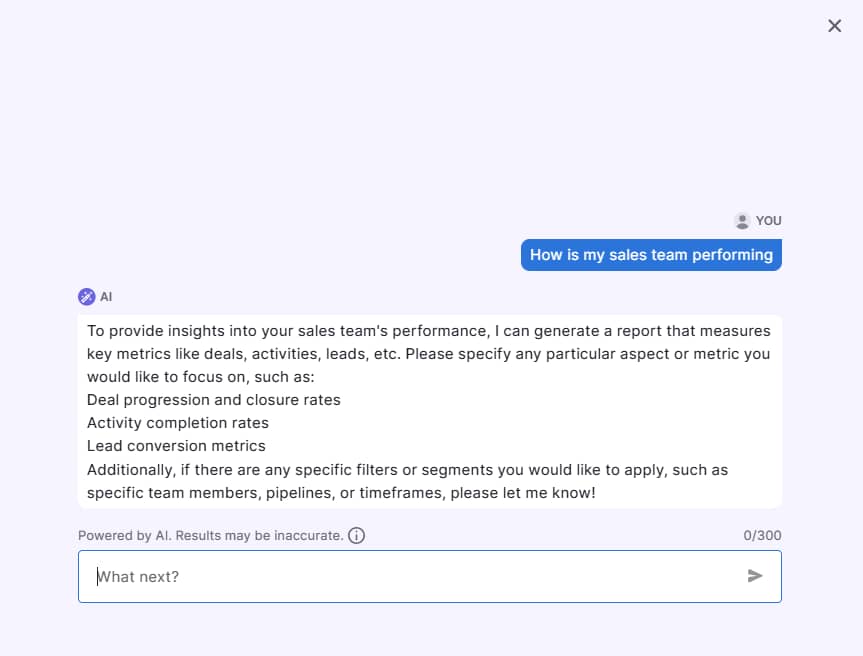
This easy-to-find data can help refine your message or timing for better results.
Pipedrive’s features help you create and share thoughtful, data-driven infographics that move leads closer to becoming customers.
9 best practices for creating high-quality marketing infographics
An engaging, informational infographic can be one of your most effective marketing tools. It has the potential to earn backlinks and boost your search rankings when shared widely.
Whether you’re creating a flowchart, process or timeline infographic, a few wise choices can ensure your content always delivers real value to your audience.
Here’s how to use infographics in marketing for the best results:
Keep it simple – focus on one key message or idea to avoid overwhelming your audience
Use plenty of white space – allow room for your visuals and text to breathe, making the infographic easier to digest
Prioritize visual hierarchy – arrange elements so the most important information stands out first (e.g., use larger fonts, bold text or contrasting colors)
Stick to a consistent color scheme – apply a limited palette that aligns with your brand to maintain visual harmony
Use high-quality icons and images – select clear, relevant visuals that support your message (not distract from it)
Include data-driven insights – include charts, graphs and statistics to back up your claims and make the infographic more authoritative
Be concise – aim for clarity over complexity with short, punchy text and let visuals do the talking
Test and optimize – monitor your infographics’ performance to see what resonates with your audience and adjust accordingly
Consider search engine optimization (SEO) – when embedding infographic images, include keyword-rich titles, meta descriptions and alt text so searchers can discover them organically
Following these best practices helps your infographics look more credible and support your broader marketing goals.
Final thoughts
A well-designed marketing infographic can boost engagement, build trust and move leads closer to a purchase.
The right tools make the process faster and more effective. With easy-to-use templates, you don’t need a graphic design background to create something impactful.
Pair that with a CRM that helps you segment your audience and automate your outreach so infographics land where and when they need to. Try Pipedrive free for 14 days and see how your marketing can directly support your sales pipeline.
